Another week, another Google Analytics 4 tips and tricks article just for you!
In this article I want to focus on the standard acquisition reports in GA4. As you might have already noticed, the acquisition section is slightly different than in UA and I am going to share some details about the two default user acquisition and the traffic acquisition reports.
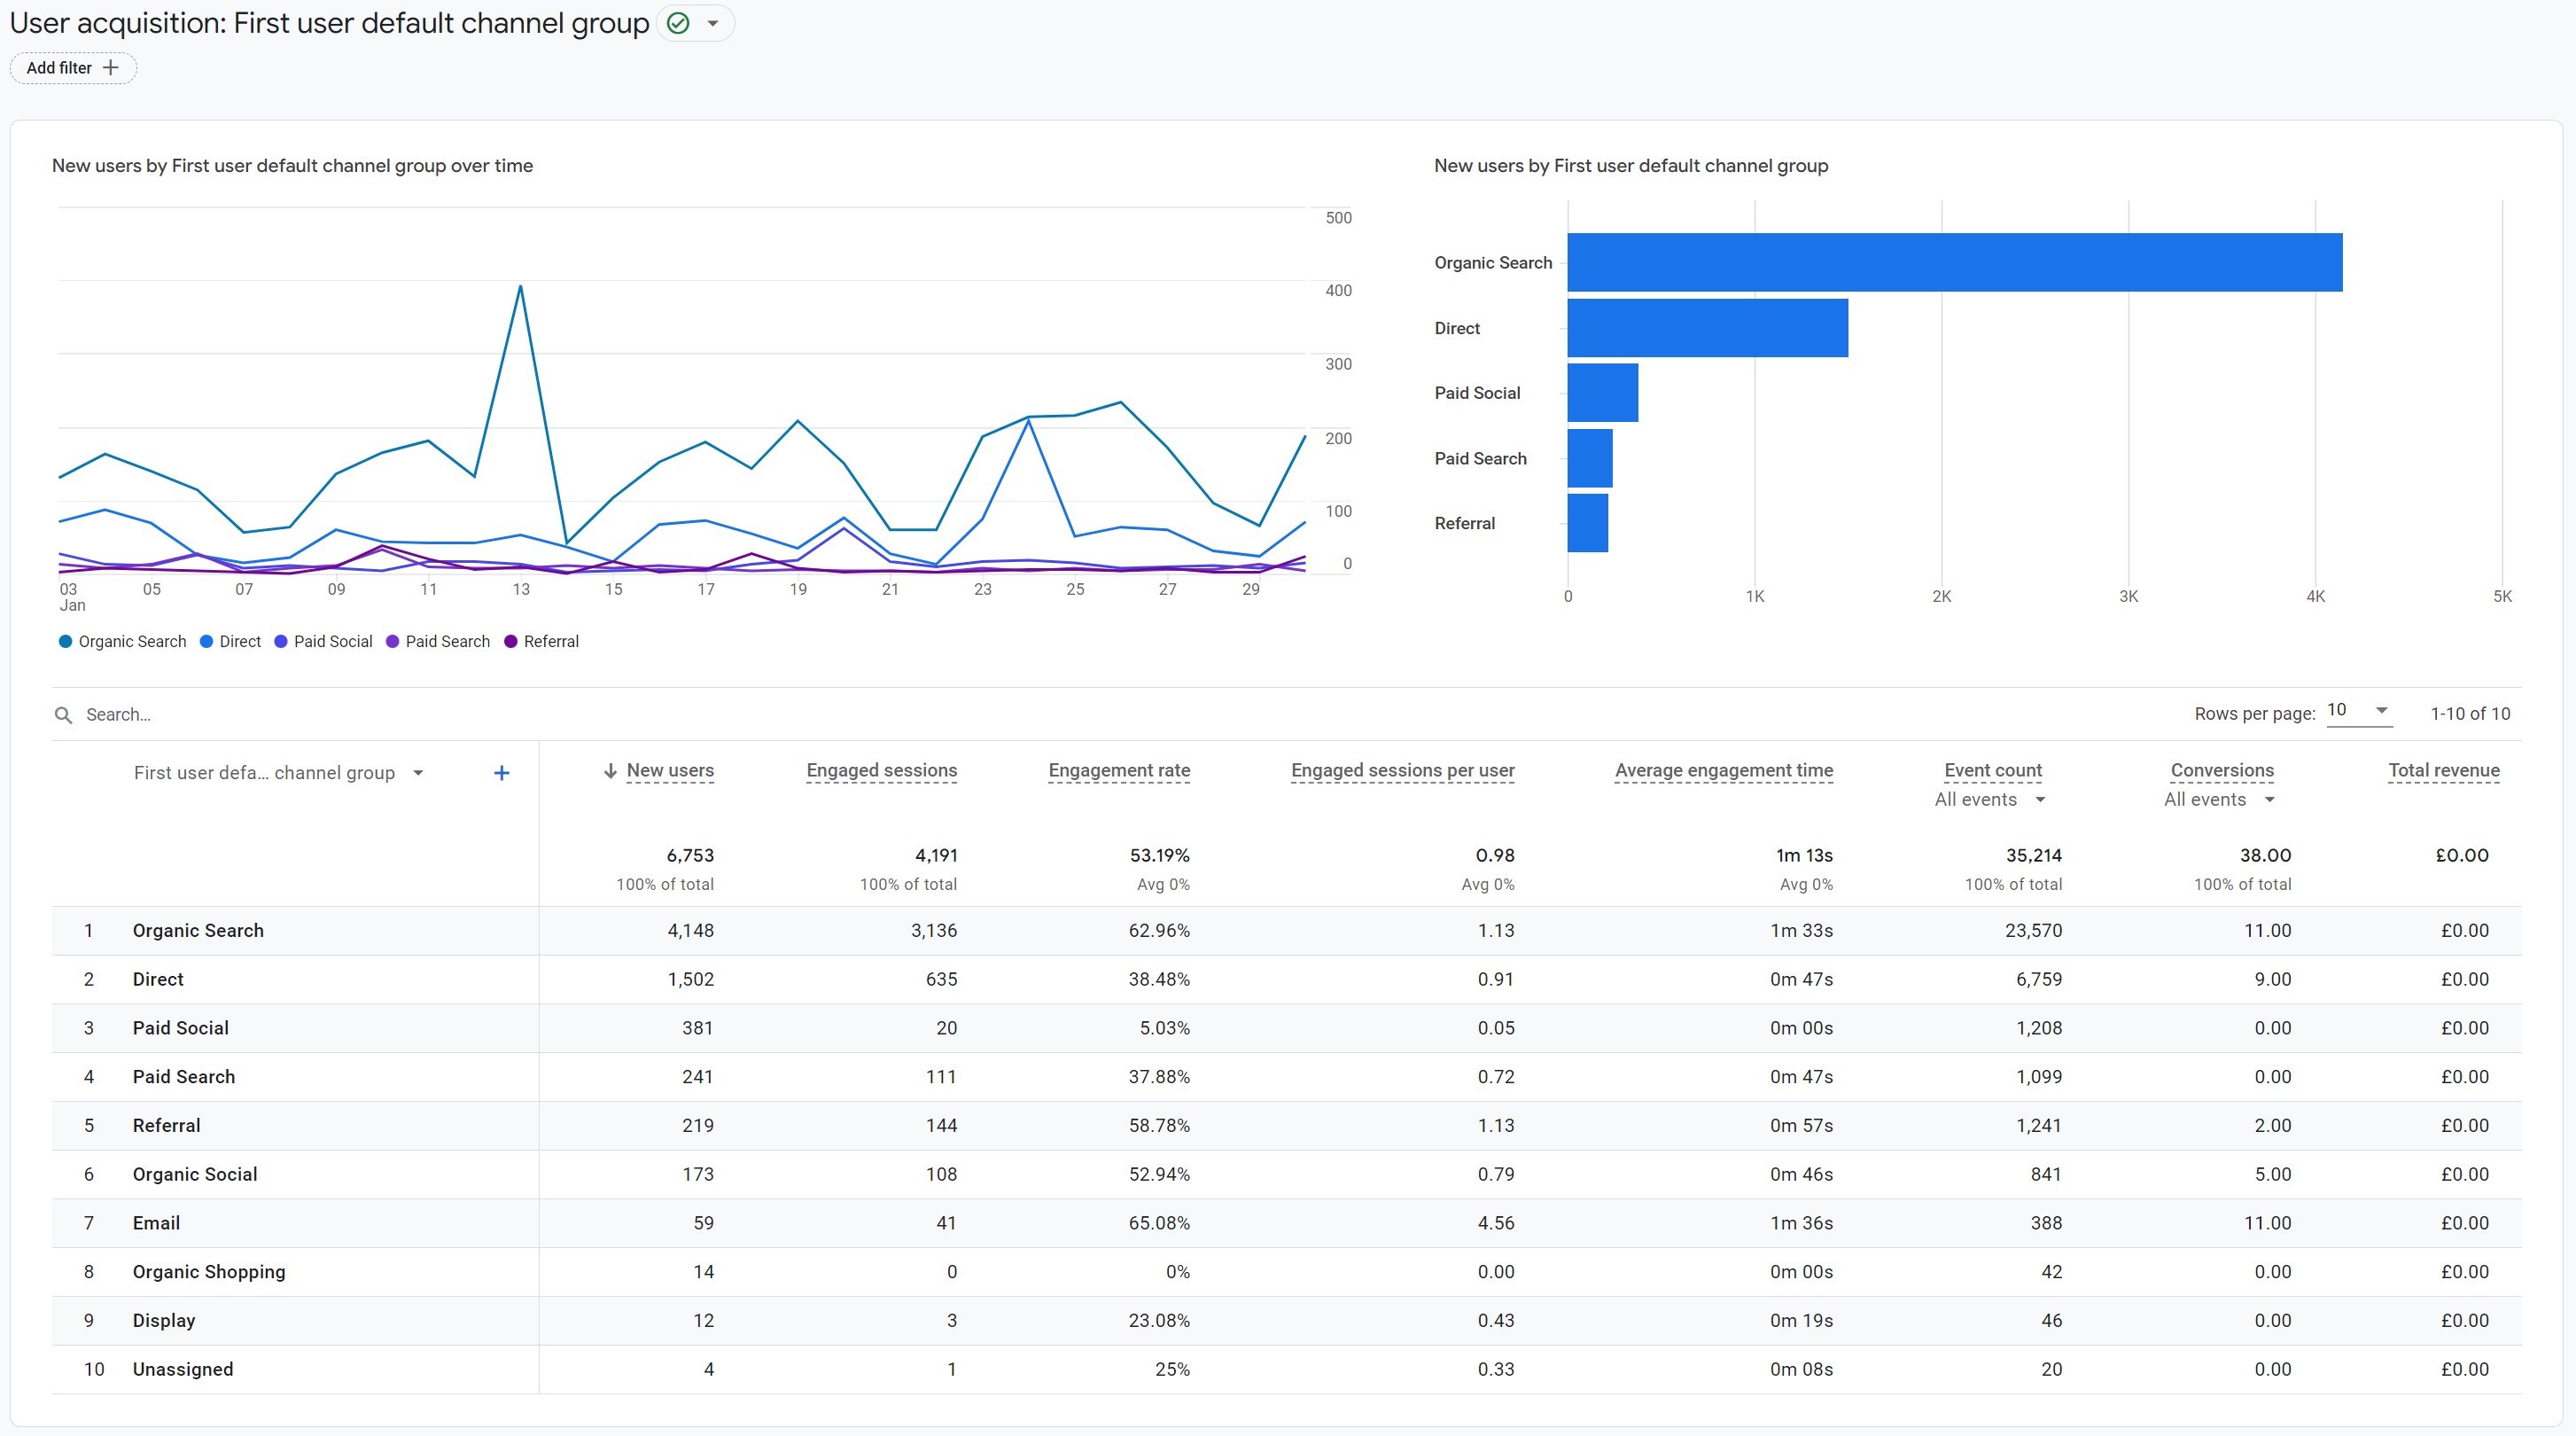
GA4 user acquisition report
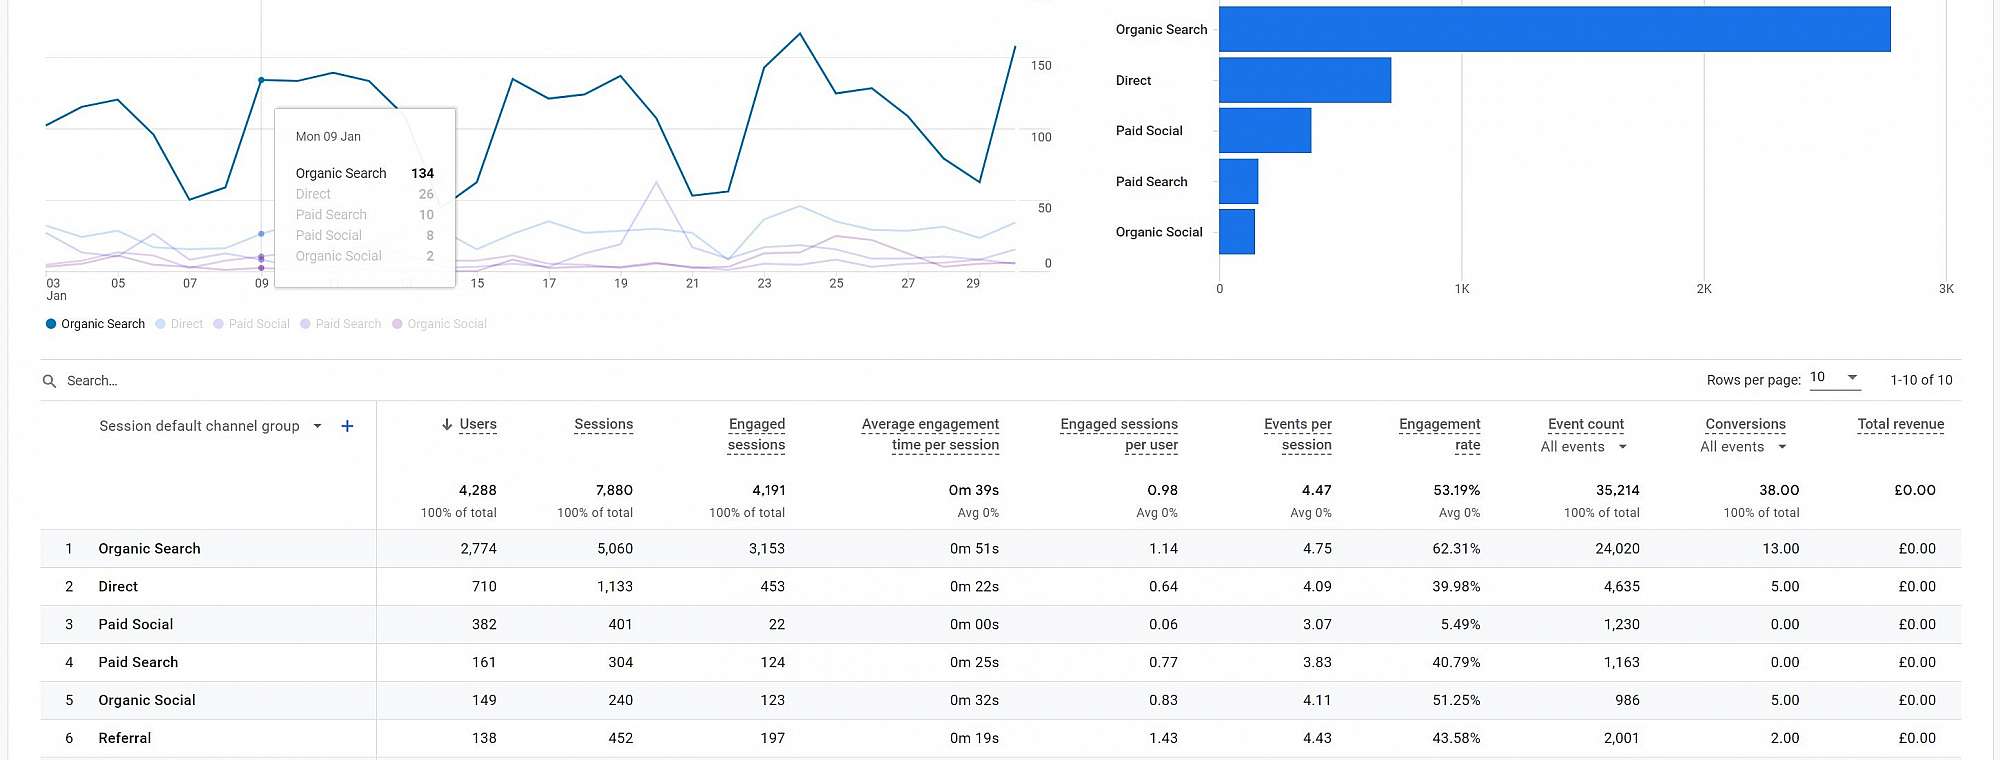
First things first, this report (and the traffic acquisition report) is divided into parts, with three graphs. After a few months testing and using this report, I can tell you that 99% of the time I focus mainly on the detailed table… Don’t get me wrong, I love the line chart, but maybe an aggregated view would have been more useful? We have no idea why there isn’t a total line!
As you’ll notice, the default dimension of this report is ‘first user default channel group’, and this ‘first user’ prefix indicates to you that the report is filtered on ‘first users’ only.
But what does this mean really? Well, it looks like Google Analytics 4 is giving us more granularity in terms of attribution, but this new type of prefix confused me when I first discovered it. Basically, this new report focuses on the source that led a visitor to your site for the first time (based on cookies) and all interactions/sessions thereafter.
Regardless of how the user visits your site on subsequent occasions/sessions, the value assigned to the channel, source/medium etc will stay the same as the original/first source.
For instance, if one of your visitors came to your website through your Google Ads remarketing campaign, after discovering your website organically that second remarketed session would still be assigned to organic search.
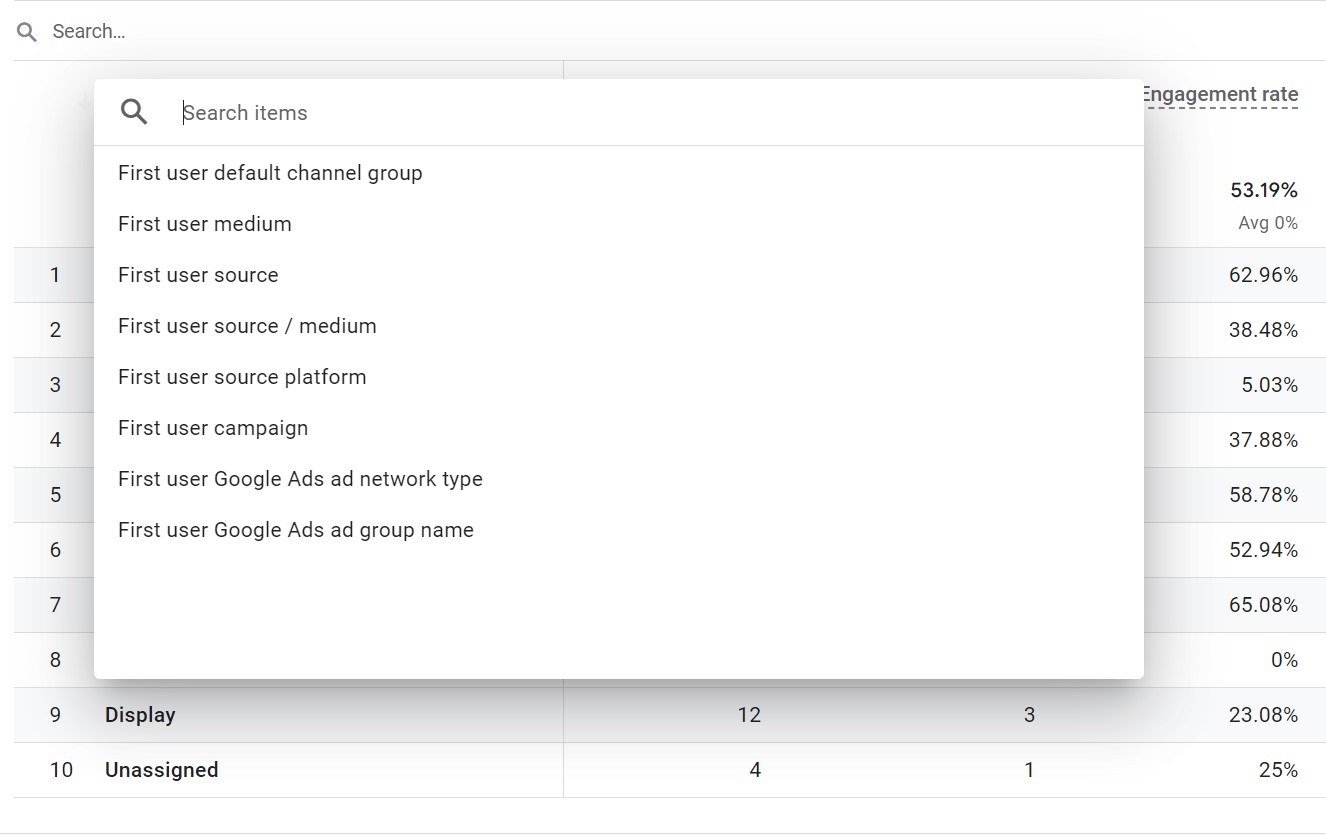
Google also lets you filter this table/report to have a granular view by clicking on the dropdown list and select one of the following dimensions:
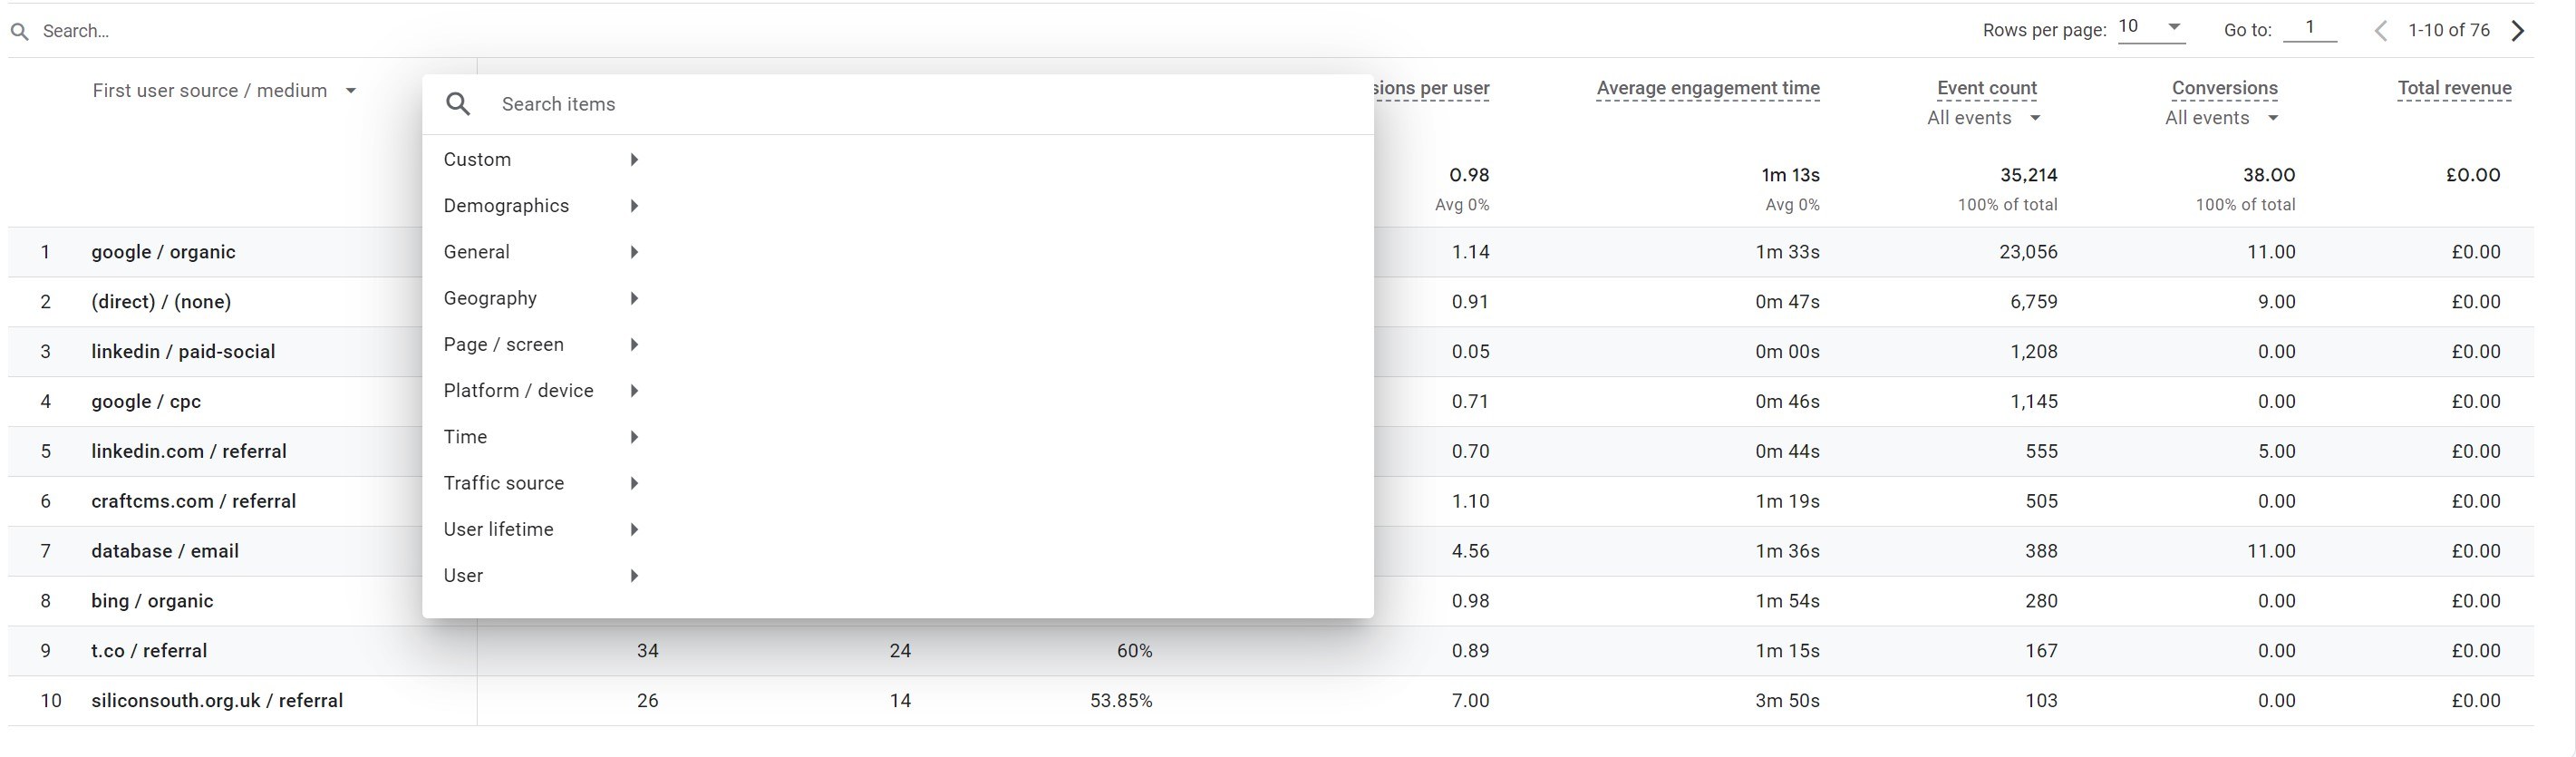
By clicking on the + sign, you will be able to add an additional dimension to this table. Which can give you another level of information.
The navigation of this report is a little clunkier and limited than Universal Analytics. GA4 has removed hyperlink navigation which used to be really helpful when navigating through dimensions. In this section you can only ever view a maximum of two dimensions and sometimes, the secondary dimension you may want, is not in the list (e.g. Google Ads keyword).
You do have the ability to filter the report, which means you could isolate the data set which would give you a maximum of three layers of filtering/segmentation. Unlike UA you can’t save this filter (like UA’s advanced segments) so you would have to repeat this step every time you need it.
If you find you’re constantly tweaking the settings of this report, and it’s something you need to report on frequently, especially at a deeper level, then you will love the exploration reports from GA4 that can be spun up from this standard report. (Unfortunately, exploration reports are a minefield, so more about these in a future Google Analytics tips and tricks article, stay tuned!)
But how is this standard report useful for you?
This is a great report if you’re solely interested in new users. Understanding what it takes to get them to your site, and also what they do once they’re there based on their acquisition source. First impressions count, and acquisition costs for new users can often be high, so placing a greater sense of importance on this aspect of your website analytics could lead to great decisions and improved performance.
You can understand engagement rate, event counts and number of conversions for each traffic source, and if you want to narrow down to a particular conversion event you can use the drop-down list and filter the table on this particular conversion.
Remember, we are attributing all metrics to the original source of the visit, if you care more about each individual session independently, then you should use the traffic acquisition report instead.
GA4 traffic acquisition report
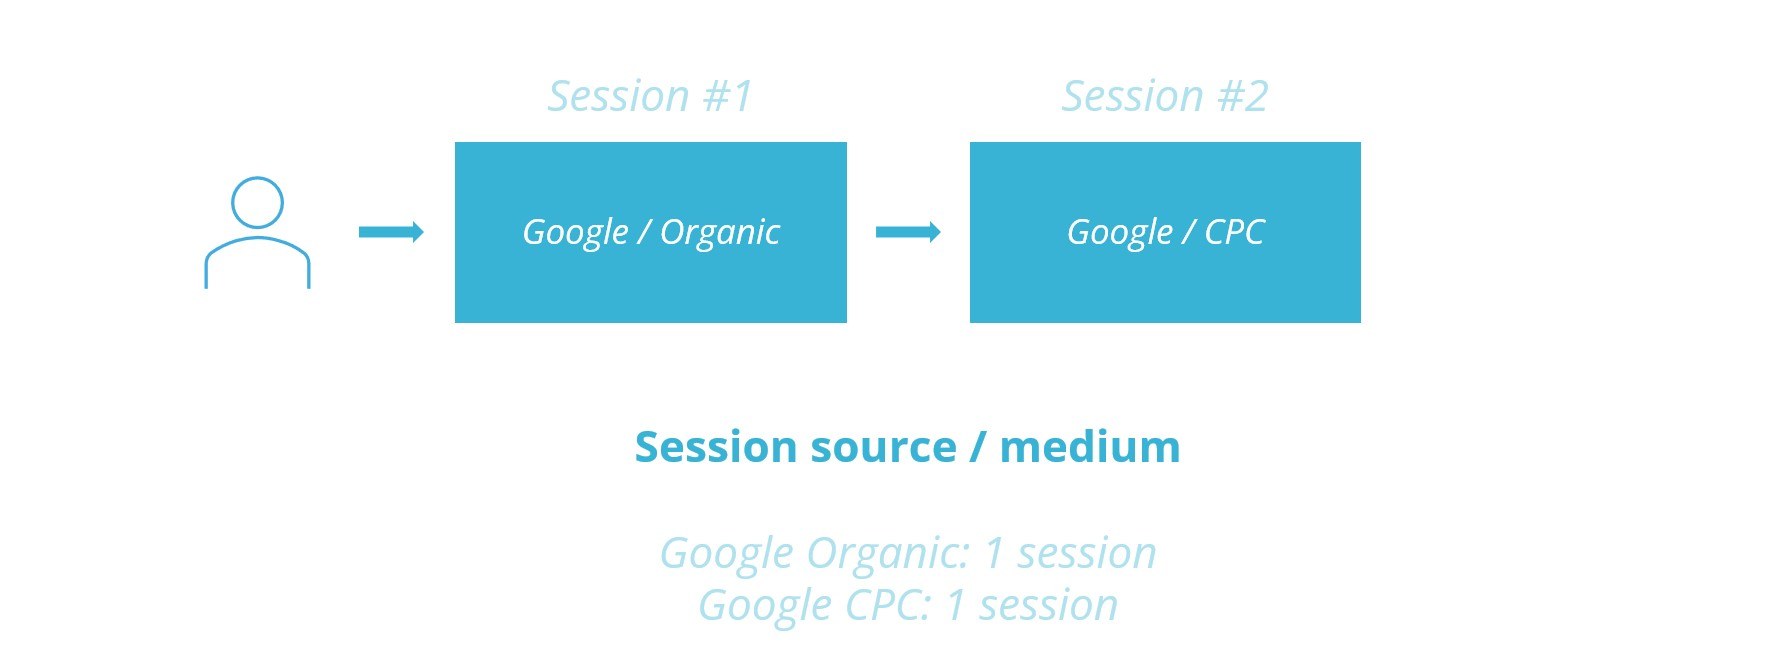
In this second default report from Google Analytics 4, you might notice one difference vs the user acquisition report. If you haven’t, let me point it out as it’s very subtle! The prefix of the default dimension has changed, in fact, it is not “first user” anymore but “session.”
What this means, is that in this report you will be able to report on each individual session regardless of whether the session started from a new user or a repeat user. This is more akin to what you’ve been used to with Universal Analytics and the most like for like example we’ve found.
For example, if a first session came from a Google Ads campaign, then the session metrics will be associated to the paid search session default group channel and if a second session (from the same user) came from organic, then it would count in the organic search default channel group. In this report, if both sessions occurred in the desired date range you would see data for each session.
This report also gives you number of users (and not specifically new users like in the previous report), and engagement metrics, event counts and conversions, (as long as you’ve setup them up in your GA4 property).
It is probably one of the most familiar looking reports you’ll find in GA4, although the experience of using it is still slightly different. If you’ve not ventured far into GA4 yet, this is possibly the best report to play around with, slicing the data with secondary dimensions and filters just to see what is and isn’t possible (compared to what you’re used to).
It is also worth noting that the data from this report (and the user acquisition report) will contain more than 14 months’ worth of data. There has been widespread misinterpretation of the data retention rules of GA4, so it’s worth remembering that in this aggregated view, the data retention rules don’t apply. The data retention limits are for Exploration reports only. More on these soon!
Before closing this third edition of our GA4 tips and trick series, for the beady eyes amongst you, you may have noticed in my screenshots an additional Google Ads report included in the acquisition menu section.
If you want to know how to set this up, check out our 2nd edition of our trips and tricks article where we show you how.
Until next time, happy reporting!


