Welcome back to our series on Google Analytics 4 which relates to lots of mini discovery, hacks and eureka moments as we, like you, navigate our way through the new platform that is Google Analytics 4.
If you missed the first one which shared tips on custom events and enhanced measurement, you can catch up here.
This article covers, reporting identities and Google ads reports in GA4.
GA4 reporting identities

Who knew that selecting a reporting identity would affect the data you see in GA4? Whilst we’re told that the method can affect how events are associated with users, we’re not told that selecting ones with Google signals will threshold your data and potentially restrict some of the levels of detail you see.
We discovered this when a client wanted to view user counts by event by day. We noticed that any custom event was not shown in a report in the UI or extracted via the API when the metric was ‘user count’. We deduced that the amount of data going through the platform was not high enough to avoid thresholding.
Over a weekly or monthly basis they had enough data to show the count of users, but as soon as daily segmentation was required the query explorer didn’t show any data for these custom events, and similarly the built-in event reports in GA4 omitted this level of detail.
Therefore any reporting identities which capture Google signals data may have reports subject to thresholding to protect user privacy.
Fortunately if you set-up the reporting identity in error, you can (it seems) toggle to a different method and suddenly the data you were after appears. I did this for the client above and low and behold we could get the daily user data we were after (even retrospectively).
However, before you’re quick to change your reporting identity, be aware that if you’re interested in using GA4 for remarketing purposes then you have to be collecting Google signal data so you must have one of these reporting identities selected.
You’ll therefore need to choose which is more important. What we are yet to establish is if you can have two measurement IDs for the same website for GA4 set-up and just change this setting on one of them - what it does mean is doubling up on everything else as event tags must be associated with a configuration tag. This could slow your site down.
Pick the lesser of all evils ;-)
- For a profile which has a low threshold of event counts and Google Signals is being used to identify users then you will NOT be able to view event data by users by day - you will only see total users for a time period
- For a profile which has a high volume of event counts and Google Signals is being used, then you SHOULD be able to segment data by day and user counts
- For a profile which has a low threshold of event counts but Google Signals is not being used, then you WILL also be able to segment data by day by user counts
A very helpful video on this subject matter which we were very grateful for.
GA4 Google campaign reports
This is one of the most confusing areas of the GA4 set-up. We were so used to dozens of reports out of the box in Universal Analytics, that the measly number they offer us now means you’ll be hunting around trying to work out if you need to create something from scratch or not.
This was the case for me with Google Ad campaign reports.
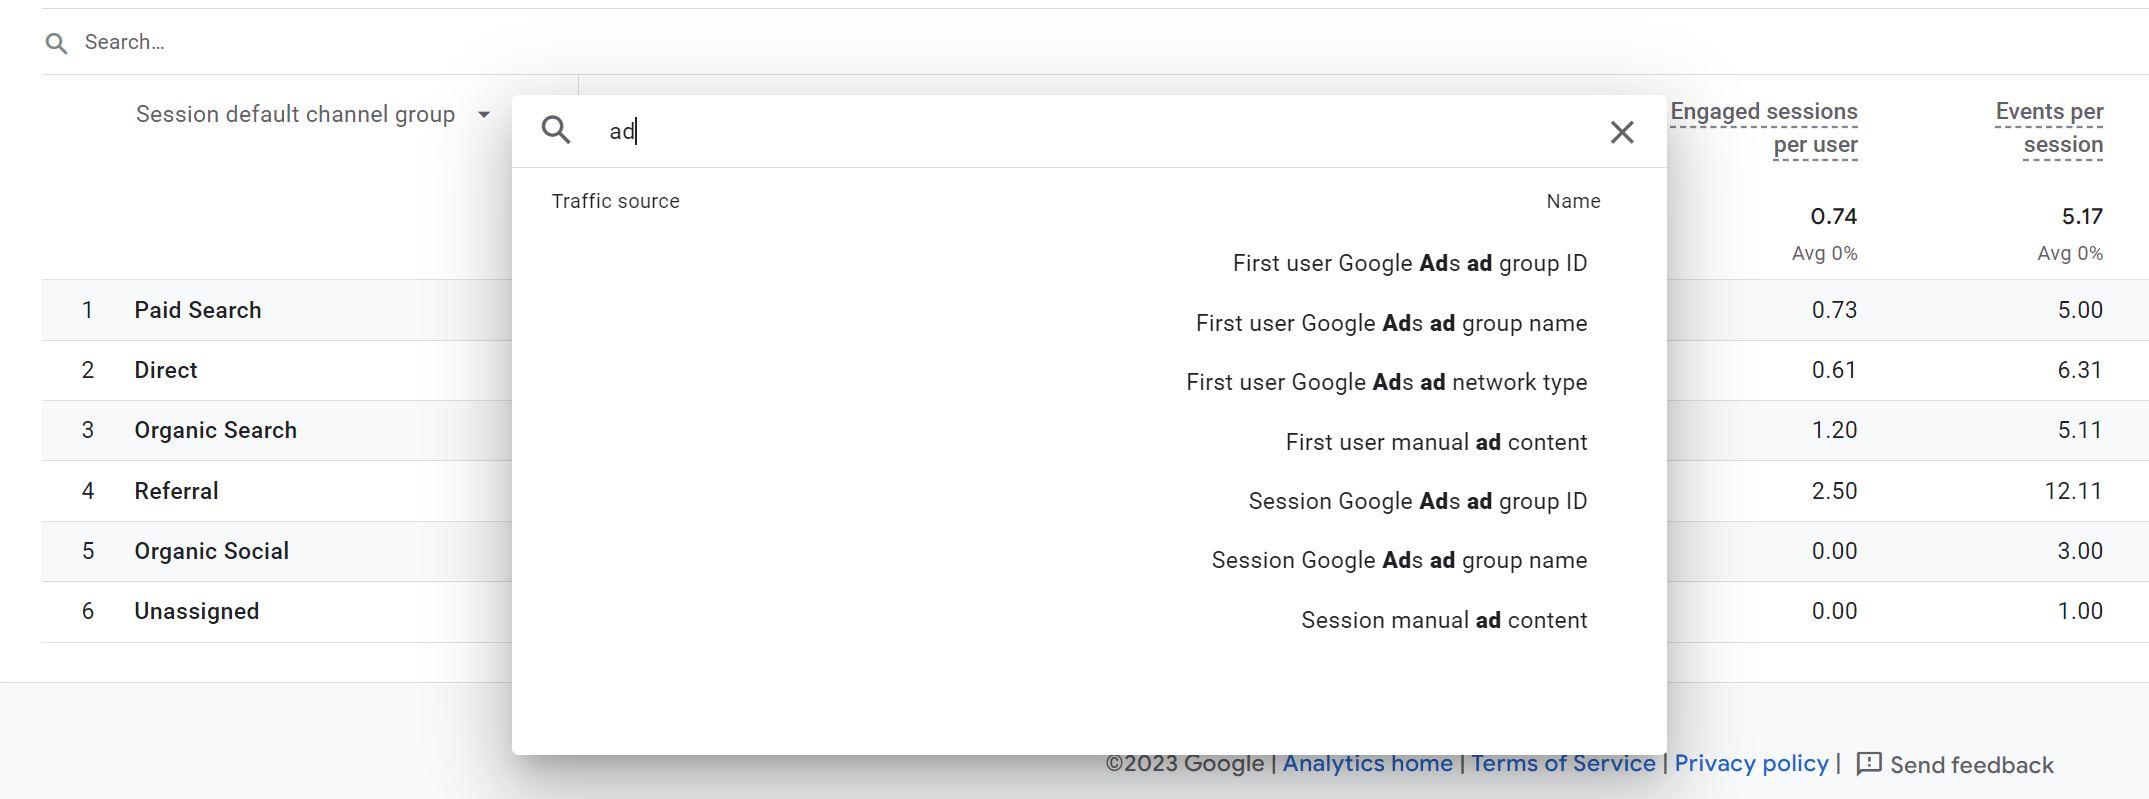
At a top level in the traffic acquisition report you can see Paid Search as a session default channel but you can only add a secondary dimension for ad group level (no Google ad campaign or keyword or search term)

But, have no fear, you don’t actually have to create this report in Explorations or in your report library because it does actually exist!
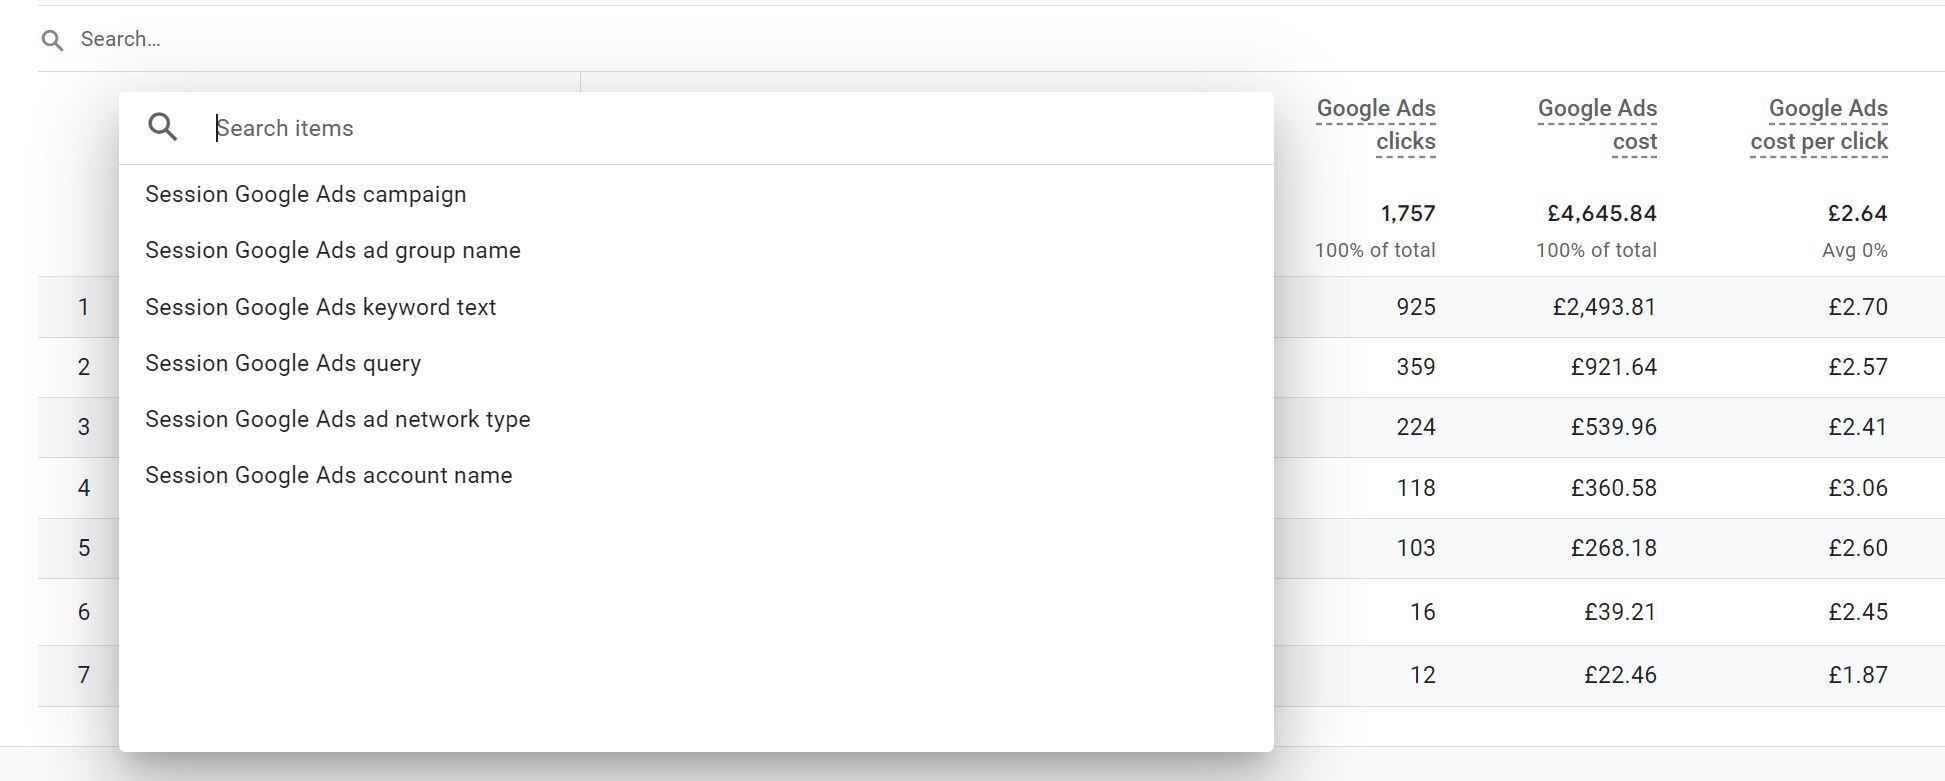
Head to Acquisition overview and you’ll find a card with Google Ads data on it. Click the hyperlink and the report you were looking for appears!

What you still can’t do is this pre-built report is segment a primary dimension by a secondary Google ads dimension, other than at ad group level as shared above, but at least you can use a variety of dimensions at the primary level.

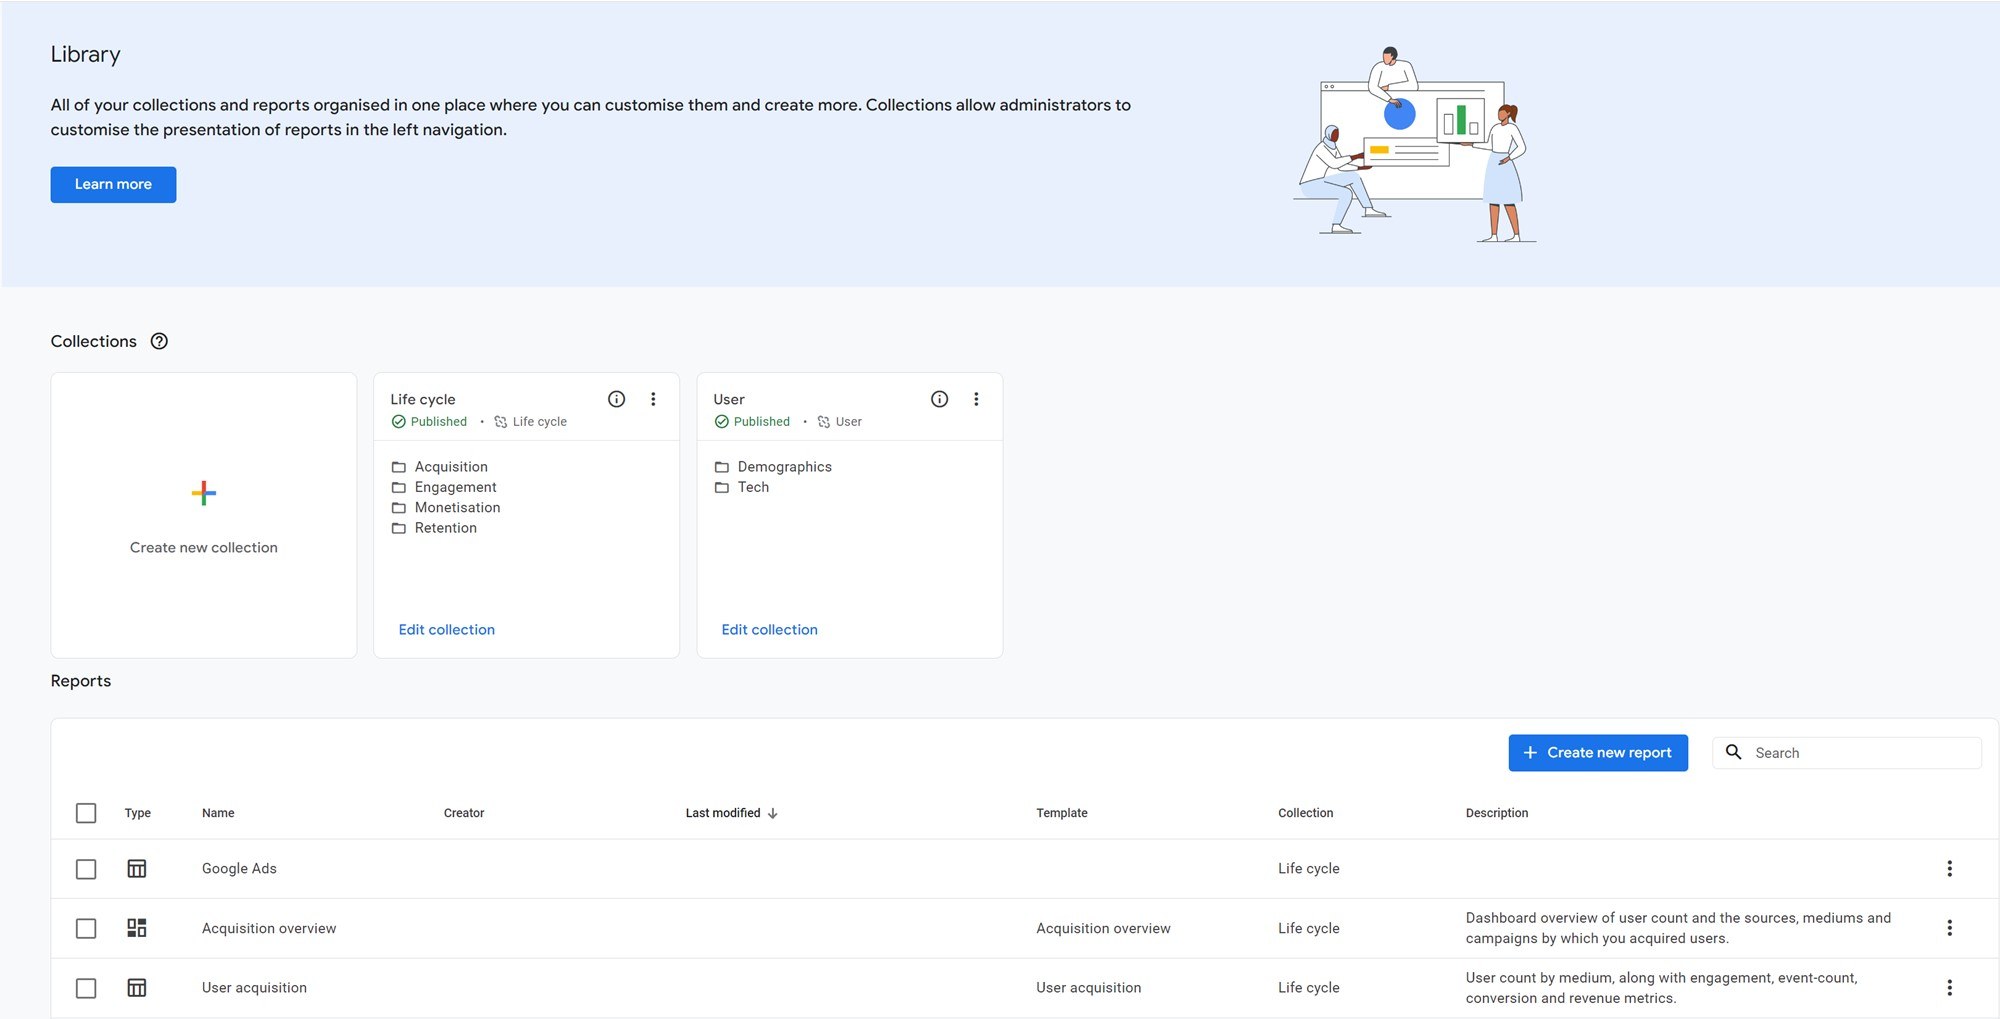
Now you don’t want to have to keep repeating this process time and time again, so you can click on the customise report icon (pencil) and this will open an editable version of the report. You don’t actually need to do edits, just click save, and then you’ll be able to find the report card in your report library.

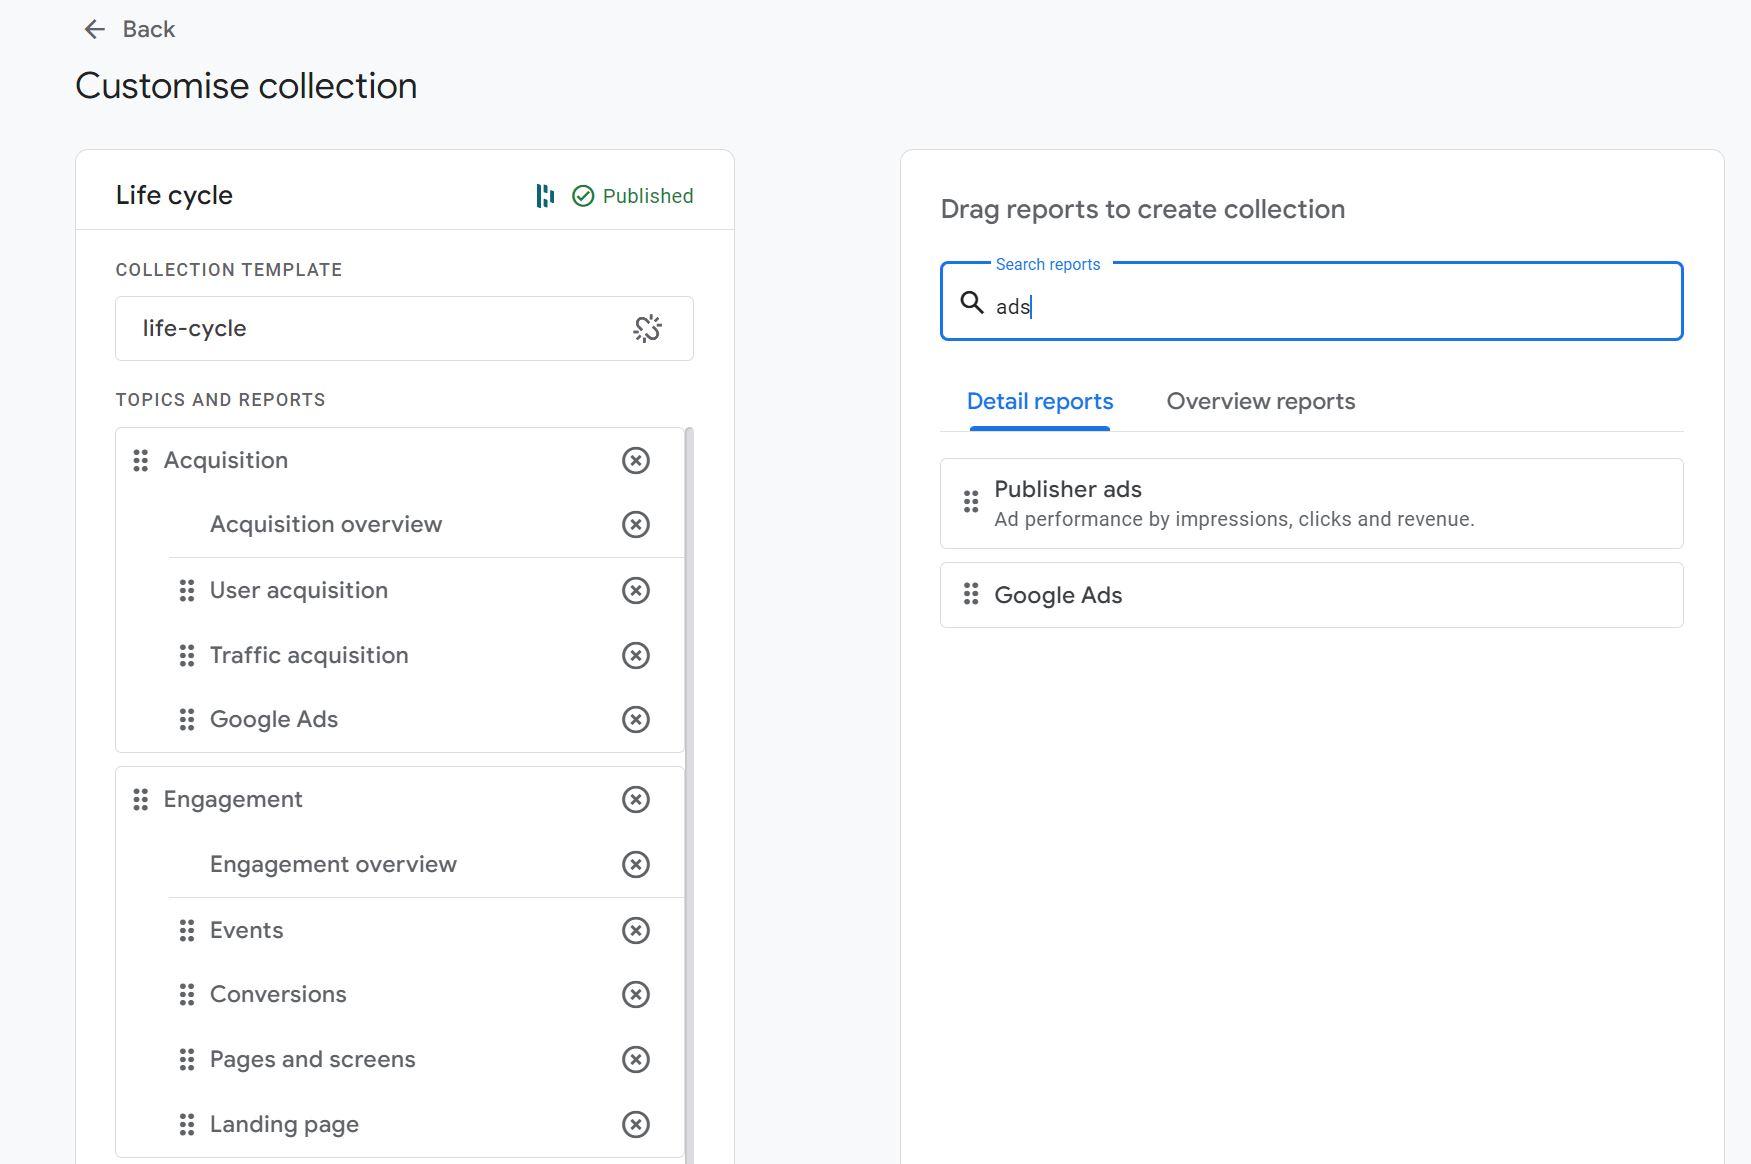
If you want to include a link into the secondary navigation bar, you can either create a new collection or you can add the link within the existing Life cycle > Acquisition section so you have a quick link to the report in the place where you’d expect it to be! You can also rename it, I’ve called ours Google Ads.

There is so much to get your head around with reports, collections and cards that we’ll have to leave this for another day. Here’s the official documentation if you want to get a head start or are in desperate need.
We’ll leave it there for now, but our next edition of GA4 tips and tricks will be up on our blog soon.


