LoveData Actually was the title of my movie themed workshop at Attention! in 2019 as I tasked myself with bringing the enthusiasm I have for marketing measurement to a group of marketing professionals.
Fast forward to February of this year, and we kicked off our series of webinars for 2021 with one on marketing measurement and improving our understanding of marketing ROI once again. We were honoured to have guest speaker Russell McAthy from Ringside Data with us to talk through his ways for improving reporting, how to forecast effectively with your data trends, and how to apply machine learning to macro and micro conversions.
In a roundabout way I’ve covered some of these topics from our perspective in previous blog posts, but I also thought in the absence of a Google Analytics example in Russell’s talk, I would share one from the workshop I did a little while ago. Sadly practices haven’t advanced too far from this method since then, so it still seems relevant for today’s marketing community.

Picture the scene
You’re a client in the insurance industry, looking to sell policies online. But due to their complex nature you often have to offer a quick quote online, but follow up with phone calls thereafter to finalise all details.
For online sales, ecommerce tracking is your saviour here. Gather data about the transaction and review the referring traffic source, and potentially attributed sources via Google Analytics. Job done!
For quotes online, to sales offline though the process is a little trickier! It gets even more complex when the quote form someone fills in could be one of many variations on-site; and some people abandon the quote journey online and retreat to the good old phone call.
Unfortunately the website also doesn’t allow for login functionality, so if a quote is generated it can only be retrieved by calling the insurer. When this happens there is no automatic tracking in Google Analytics that a sale has subsequently occurred.
So as you can see having uniform conversion points is hard to identify!
But that’s where we came in!
The tracking and reporting plot
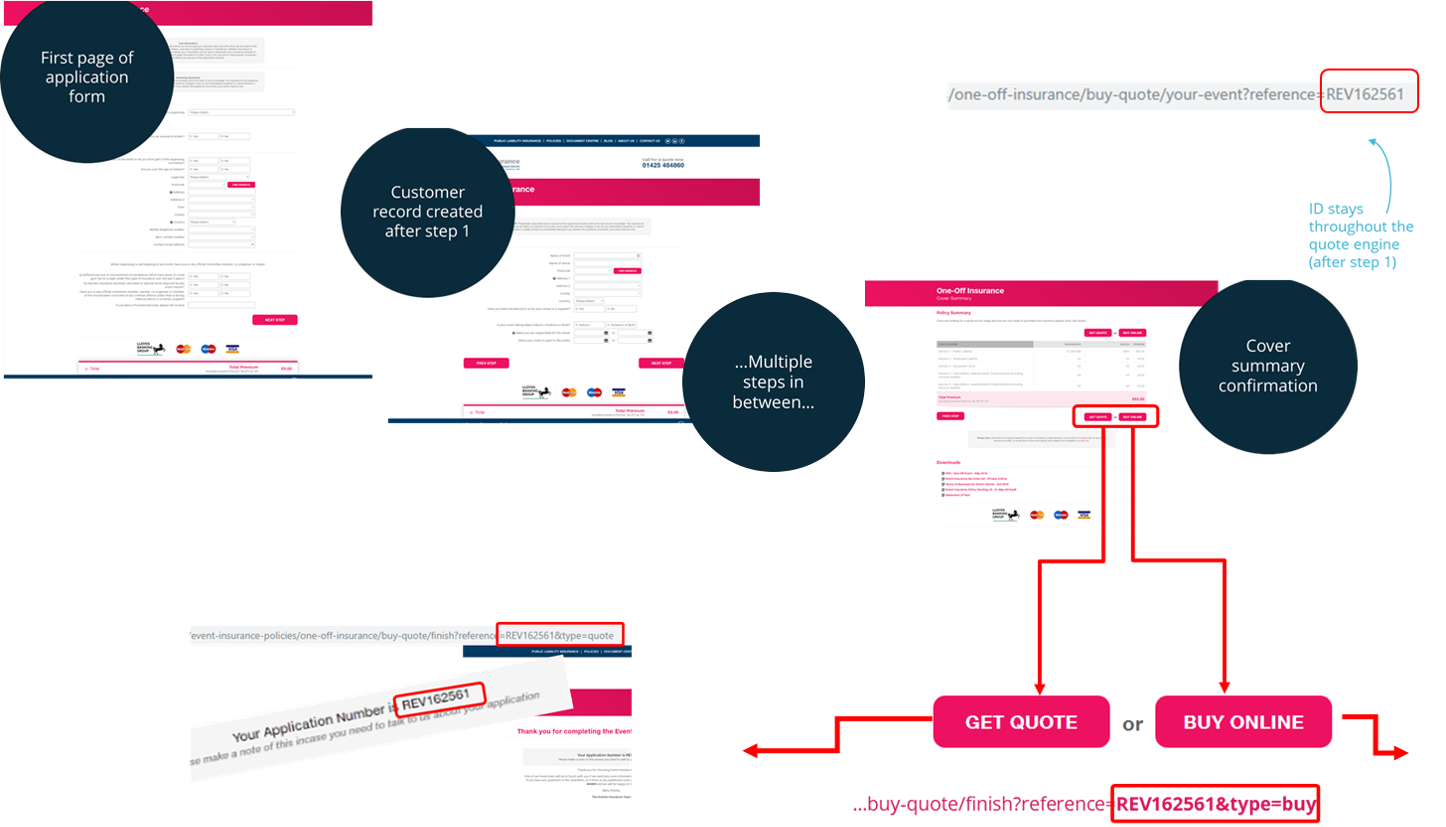
On the first page of the quote application form, our client creates a unique customer ID / reference number. This persists throughout the whole journey within a query string field in the URL (e.g. ?reference=12345). There may be a different combination of steps between first step, and last step, but every final confirmation gets an order reference number.
On this quote confirmation page, the customer can either [save quote] or [buy online] straight away. Either way their details are stored in the client’s CRM. If they abandon their application midway through, their record is still stored for a period of time. On occasion the business can decide to follow-up with the customer to complete the process, and convert them offline.
With the help of website query strings we’re able to identify whether someone saves their quote (reference=1234567&type=quote) or buys the policy reference=1234567&type=buy). These are handy query string fields that can be later used for analysis, and tagging up goal tracking.
We identified three key conversion journeys through to sale:
- Initiate quote - complete quote - buy online
- Initiate quote - complete quote - buy offline
- Initiate quote - abandon quote online - convert quote offline - buy offline
In step 3, the quote is converted offline by the client, and the customer purchases offline, but we were really keen to still attribute back the sale to the online traffic source (as let’s face it, it did a lot of the hard work). So all three pathways needed to be tracked and analysed, and reported back to an ROI.
As this client (like many others) didn’t have the budget to invest in powerful attribution and tracking tools, which could set them back £100s if not £1000s of each month, we created a workflow that could get them part of the way there, and would at least allow them (at a last online interaction level) to evaluate their online marketing efforts better.
Taking our two main data sources, Google Analytics and the client’s CRM, we stitched together information using the unique reference ID. By plugging into tools like Supermetrics, and using Google sheets we were able to automate much of the data collection, stitching and reporting (including extracting spend data from advertising platforms).
The workflow itself did require a custom solution, but essentially it was a series of interconnected spreadsheets and dashboards, culminating in an ROI figure for overall performance, by traffic source and by policy type!

At a glance our client can see total quotes, total sales, total revenue, website sessions, marketing spend, conversion rates and ROI by traffic source and campaign (and keyword if we so wish).
Wherever possible we identify where sales offline have been reattributed to online as this helps us evaluate how much offline support customers require. It can sometimes also allay our fears when quotes can take a while to convert into sales.
There are always data mismatches, so there is a pot for an ‘unidentified’ source. This retains a place on the overall performance report as a % of sales which are unidentified, and is regularly reviewed to ensure it doesn’t grow beyond a reasonable level (which could indicate a tracking flaw).
Why do we go to all this trouble?
In the early days, Google Analytics was only offering us a part of the picture. Micro conversions were being tracked, but quality and overall value of the customer was not being appreciated.
If we were going to dial up marketing spend, or shift budget into a new traffic source, we needed to be confident that it was serving up the right kind of customer, and it was profitable for the business to do so.
We use this more powerful data set to assign return on ad spend, and return on investment values to digital marketing channels. This has been used to increase and decrease spend in areas to improve ROI.
We have also been able to review gaps in live performance, and in turn forecast expected results by looking at trends in the data and extrapolating a direction for future performance.
The patterns discovered in the data help with tactical promotion and also firefight issues, offering the business a level of intelligence they’d never had before.
There is a limitation with our approach though. Our manual solving of this reporting problem does mean we rely on last action data. Whilst at a micro conversion level Google Analytics can offer us some attribution analysis for assisted conversions and user paths, it’s the macro conversion (the final sale) which falls short of this level of intelligence.
There are some solutions (hooray!)
- Import final sale data into Google Ads using their gclid import - this would at least allow Google Ads to report on influenced conversions for the part it plays in the customer journey
- Invest in a third party tool which is designed to do the heavy lifting for you, and introduce extra features like first click analysis, or multi-touch point attribution.
These third party tools have been created for a reason, and hold a value in speeding up or improving marketing intelligence. When the time comes where manual interventions and processes are falling short, it is wise to consider investing in them.
The perfect ending
To summarise my LoveData Actually workshop, I finished with these main takeaways:
- Ensure you have an ID to match data sources together
- Evaluate the data sources you will need to reference, and how often this information is required
- Scope out the reporting process and end game
- Maximise automation with formula and API connections
- Identify KPIs which will inform decision making
- Segment reporting views to offer different narratives and raise pertinent questions
- Look beyond last click to get a universal view of your marketing efforts


