Following our successful webinar on "How to measure marketing ROI more effectively" featuring Russell McAthy from Ringside Data we thought we’d distill his brilliant talk into our top 5 takeaways.
If you’d like to watch the webinar first-hand then you can now catch up on-demand.
The webinar touched upon three key themes:
- It’s fairly easy to explain what is going on
- It’s often harder to understand why
- It’s always harder to predict what is about to happen, but we should strive to work it out
This session aimed to explore what we can learn from past performance to forecast the future, and be confident about what might happen in order to measure marketing ROI more effectively, and to make better decisions.
Reports and dashboards
1. Make sure your reports show trends and forecast the future
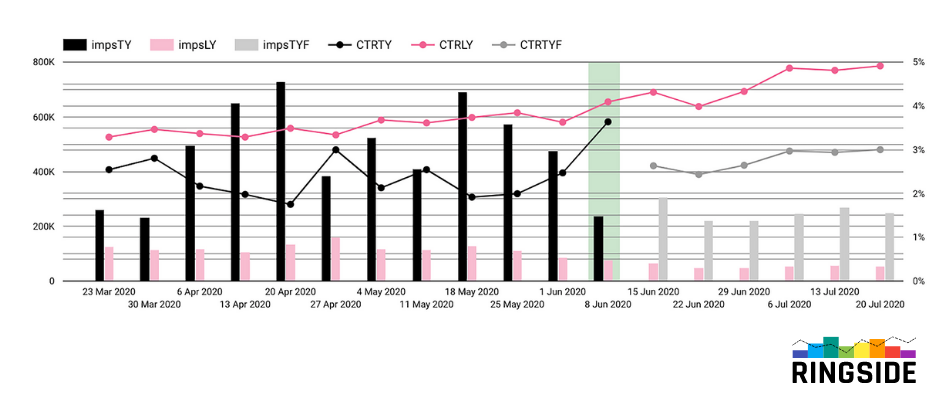
For many of us we’re pretty confident analysing past activity, collecting and assessing what has happened, and displaying results in graphs, charts and tables. However this only demonstrates an understanding of what has happened, and really we want to know what is going to happen in order to make better decisions and have action-based outputs.
Using as much historical data as possible, you should calculate run rates for future performance. This requires some confidence in using the right indicators of success and hypothesis into what might happen if “everything behaved as expected.” It also requires a commitment to trend analysis. Spotting trends over time and using these to guide decision making is really important to the accuracy of run rate analysis.
Russell also stressed the importance of showing one value based metric on a graph at the same time as one calculated based metric in order to improve context and reveal more insight. Don’t apply and compare two value-based or two calculated at the same time, they miss out on context and inter-relational analysis.
For the more advanced amongst us, Facebook’s time series forecasting model was mentioned, and can be explored in more detail at Prophet. Have your Python and R skills at the ready!
Consumer journeys
We've probably alll seen and/or even behaved in a way that makes us appreciate that many converting journeys are more complex than a single visit. Consumer journeys towards an end goal with your business, are also not the same, and whilst many may start and end in a similar fashion, what happens in between can vary greatly. Here are four key actions to consider to improve your knowledge:
2. Define your micro conversions
Most companies have a macro conversion set-up in their analytics platform. This is the goal that defines the end of the consumer journey, usually a sale, but could possibly be something like a lead.
Micro conversions are the smaller actions on-site which demonstrate that a user has engaged with your business, and could indicate future conversion behaviour - for example: add to cart, viewed a product page, looked at delivery details, started an application form.
There are so many possible on-site actions, interactions and pages that could be classified as a micro conversion, that it’s important to establish what matters to your business. Do you have all key indicators tagged and tracked appropriately, and are you monitoring the hit counts on these micro events in order to establish how valuable your interactions are with a customer, and how important certain channels are in creating these moments?
3. Not every visit is equal, so think about placing value on more than one event
You may be familiar with attribution models which take you beyond a last click attribution of conversion credit. If you're not, you can find out more about the most common ones in Google Analytics from this article.
Russell stressed the importance of understanding CONTEXT in order to determine the best attribution rule for your business. As well as where a channel appeared in a conversion journey, it's important to appreciate other factors such as:
- Pages viewed (and quantity)
- Device of visit
- Day of week of visit
- Recency and frequency of visits

Using dimensions such as these, as well as micro conversions, can allow you to understand what elements are (the most) influential in a converting journey. This in turn can help you start to build a picture on what matters most, and how you can enhance their impact for better results.
You will also need to establish these in order to take advantage of machine learning later down the line.
4. Machine learning can take your data game to a whole new level
This is not something to rush into implementing if you haven’t got your data tracked and tagged correctly, nor if you haven't mastered forecasting and understand performance patterns at a simple level. However, when the time is right, it’s worth opening your eyes to the power machine learning can have on everything you’ve learned up until now.
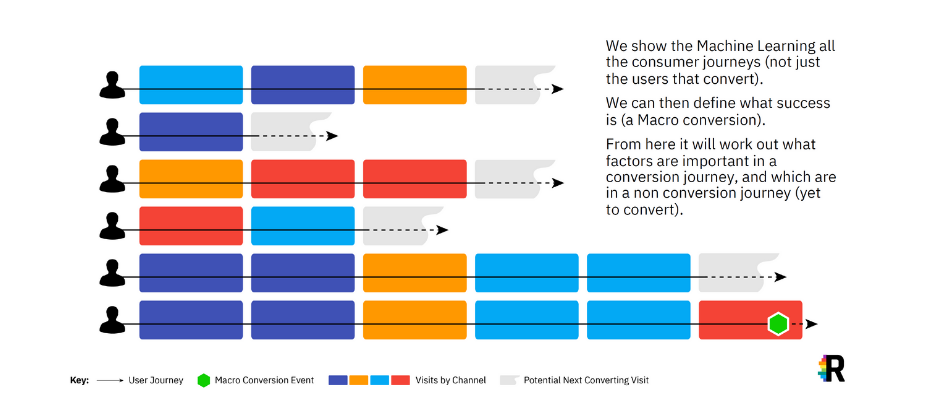
Russell’s advice for machine learning is to feed the machine with three things:
- data sets of converting user journeys
- definition of what success look likes (macro event)
- the complete data set with everyone involved whether they’ve converted or not
It will become the machine’s job to work out what factors amongst the myriad of possibilities and eventualities are important to converting journeys, and also spot those potential converting journeys off the back of what ‘good looks like.’
Model accuracy will play a part in determining confidence levels in what the machine proffers, and it’s at this stage that you really need to look to data scientists and/or statisticians to help with this. Acronyms such as AUC and ROC were mentioned in the presentation, don’t worry if this doesn’t make sense to you… there are plenty of people out there who can run this analysis on your behalf.
Find out more about the AUC - ROC curve
5. Work towards data driven attribution
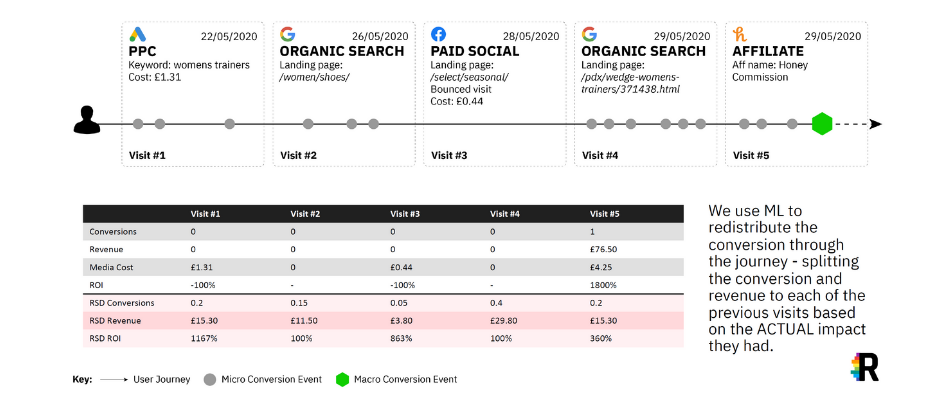
Once you build up all these layers of data, and you have a powerful AI-driven machine behind your data crunching and analysis, it is possible to put data-driven attribution into practice. For some Google Ads advertisers, and Analytics 360 users, data driven attribution is already available, but as it’s Google-owned it’s concentrating most on Google data, so I’d always advise working with a 3rd party platform for this level of sophisticated attribution. The guys at Ringside Data, may be able to help you!
The wealth of MI/AI data could help you assign credit to journeys based on:
- channel position in journey
- behaviour of user during journey (micro conversions)
- recency and frequency of visit(s)
The top 5 takeaways
So there you have it, beginner, intermediate and advanced skills and techniques on how to measure your marketing ROI more effectively!
- Make sure your charts show past trends AND forecast future performance
- Define your micro conversions
- Place value on more than one interaction/event on your website
- Once you've mastered the basics, and your data is good, look into machine learning capabilities
- Work towards a data-driven attribution model to reveal the actual impact moments had on conversions


