Here we are, halfway through 2025, so it’s time to glance back at the last quarter of travel searches on Google in the UK. As with all our previous reports we’ve published, we go to great lengths to look at every nook and cranny of the travel world, from cruise trips to adventure holidays and everything in between!
As this is our eighth quarterly report, we took the opportunity to review and refine our keyword lists more thoroughly than ever before. While we've consistently added to these lists over time, we started to notice some gaps in our coverage. In particular, we found that certain destinations attract more searches at a city or island level rather than at a country-specific level. And perhaps more importantly, Google’s Keyword Planner presents data in a way that doesn’t always reflect this nuance. In hindsight, this might’ve been something we should have picked up on earlier, but it’s not until you kick around a few spreadsheets that you start to notice certain things.
With that in mind, we’ve beefed up our reports using ONS data to look at the most popular destinations travelled to from the UK and then expanded our city and destination list to include the most popular destinations within those countries. Taking Spain as an example, we can see that places like Tenerife and Benidorm get substantial search volume compared to generic phrases, which I assume is due to the familiarity of these destinations to millions of us in the UK (having a TV programme called Benidorm on TV for many years would’ve certainly helped too!) Whilst we had previously included some of these locations, we’ve expanded them out now across the biggest travel destinations globally and we hope to continue to evolve our reports going forward.
Now onto the good stuff!
Biggest search growth in Q2 2025
Country |
Sum of Q2-2023 |
Sum of Q2-2024 |
Sum of Q2-2025 |
Sum of Q2%25v24 |
guatemala |
4200 |
3900 |
7700 |
97.4% |
bermuda |
39000 |
39010 |
71520 |
83.3% |
trinidad and tobago |
7200 |
8200 |
14200 |
73.2% |
tunisia |
62500 |
71500 |
114100 |
59.6% |
bhutan |
3180 |
3900 |
5600 |
43.6% |
seychelles |
56700 |
44400 |
62500 |
40.8% |
ecuador |
4200 |
3780 |
5300 |
40.2% |
south africa |
49240 |
45150 |
63050 |
39.6% |
philippines |
78300 |
82400 |
114100 |
38.5% |
namibia |
7700 |
8200 |
11200 |
36.6% |
% increase in Google searches in Q2 2025 v Q2 2024 (total over 5000)
There are some unusual names in this quarter’s trends which have appeared for the first time – Guatemala and Bhutan are small countries (and get low searches) so it doesn’t take a huge amount of change for them to appear. For destinations like Bermuda and Tunisia though, there has been a genuine improvement in demand for this quarter. With Tunisia particularly, we’ve seen some positive press in recent months about the improved safety of the country, given a recent history of terrorist attacks and unfortunate ties to the war in Gaza, despite being many miles away from the fighting taking place.
Popular destinations like Seychelles and South Africa have also had good comebacks after drops in demand in 2024.
Biggest search losses in Q2 2025
Country |
Sum of Q2-2023 |
Sum of Q2-2024 |
Sum of Q2-2025 |
Sum of Q2%25v24 |
belize |
7200 |
13400 |
7200 |
-46.3% |
grenada |
9400 |
14600 |
8700 |
-40.4% |
albania |
103200 |
244500 |
150560 |
-38.4% |
turkey |
356580 |
371500 |
236460 |
-36.3% |
panama |
97850 |
107240 |
78840 |
-26.5% |
greece |
971260 |
1046740 |
783120 |
-25.2% |
south korea |
36800 |
59200 |
46900 |
-20.8% |
romania |
10100 |
11600 |
9400 |
-19.0% |
jamaica |
58400 |
66600 |
54300 |
-18.5% |
bulgaria |
61700 |
79700 |
65100 |
-18.3% |
% decrease in Google searches in Q2 2025 v Q2 2024 (total over 5000)
The most notable drop in search demand this quarter is for Albania which saw a large decrease in search volumes of 38%. We have written extensively about the huge popularity of Albania as a travel destination in recent years and how it’s grown, so to see it appear on our top ten losers list - and with such a drop - is quite a surprise.
Similarly, Turkey losing 36% search volume year on year was also unexpected especially given the significant investment Turkey’s (or Türkiye as we should now call it) tourism board has made in travel events in recent years. However, as has been mentioned in previous quarterly updates, travel is not immune to world events, be them manmade or not, and the news regarding the wild fires of recent months would’ve certainly made people think twice about booking their summer trips there.
Other notes from Q2 2025
- Overall searches for Q2 2025 were up by 3.6% year on year. This is good news following a small drop of 3.3% in Q1 - and also very important to note, given the incredible hype from some about how travel is being searched for. Overall searches in the UK don’t seem to have taken any hit at all for this quarter at least.
- Walking holidays saw the biggest growth of all travel types with an increase of 18.8% for the quarter. Terms like ‘walking holidays italy’ and ‘walking holidays scotland’ saw some nice increases in volume, along with walking locations around Spain
- Cruise once again shows no signs of slowing down, with an increase of 9.7% in overall search volume. This is a 10% increase on 2024, which itself was also up 12% on 2023. In all, cruise holidays and brands have seen a 22.8% increase over two years which is phenomenal growth. How long that can carry on for remains to be seen but for now, cruise still rules the waves!
- Whilst cruise searches continue to grow, searches for package holiday and all-inclusive terms have dropped significantly. Overall, the ‘package holidays’ category was down 12% year on year with some terms like ‘package holidays croatia’ and ‘package holidays turkey’ down 41% and 49% respectively. With more and more travel being booked via the big OTAs like Love Holidays and On The Beach, there is a case to be made that these companies are getting better at keeping their customers and stopping them from searching on Google for deals and offers. For more on recent consumer behaviour, do check out the TTC Travel Casts - they are a fantastic update on what’s happening right now.
- From a continent perspective, this quarter saw big growth in searches to North America which is perhaps a surprise given the ongoing Trumpslumpism which has been widely reported. North America isn’t just the US though and Canadian searches were a big part of the rise overall, with ‘holidays to canada’ up 112% year on year. Other destinations like Trinidad & Tobago, Dominica & Antigua and Barbuda all saw big increases while the USA itself dropped across many locations with New York, LA and Las Vegas all down around 20%.
- The other huge growth in searches for North America was linked to, yep, you guessed it, cruise searches. ‘Caribbean cruise’ was up 238%(!), ‘bermuda cruise’ a healthy 83% and ‘transatlantic cruise’ up 35% (and racking up over 100,000 searches for the quarter).
So what? Well, we know that cruise is on the up and up and up and all our data shows that this is still very much the case, with particular favour being shown to more exotic and warmer climes. If you sell cruise to the Caribbean, it’s a good time to max out your opportunities. For those selling US holidays directly, there are perhaps more tough times ahead if the Trump and USA brands continue to suffer. Anyone selling package trips faces an incredibly tough decision – to go against the big operators who are increasingly dominating or try and resell through their own channels first. With the Jet2 memes doing the rounds this summer, it’s even harder to turn them off!
Are the big travel destinations still popular?
As mentioned earlier, our travel search term list is influenced by where we travel to capture and reflect the actual booking demand shown in the market. The top five countries we holiday in according to the ONS in 2023 were Spain (by a long way), France, Italy, Greece and Portugal.
Given the huge growth in cruise searches, I was interested to see if this had any knock on effect on the traditional hotspots (both for bookings and temperature wise). Looking at just raw numbers didn’t really show huge trends as searches for Spanish islands and cities are so far ahead of every other country and showing this graphically was a slight challenge. Given the events of 2020 and the two years that followed, I wanted to see how travel fared since 2022 - perhaps the first ‘normal’ year of travel post covid - and how search demand had fluctuated.
Below outlines the change month on month % change since 2022 to give us an indication of how popular (or not) our top five destinations have been since things have returned back to normal travel rules.
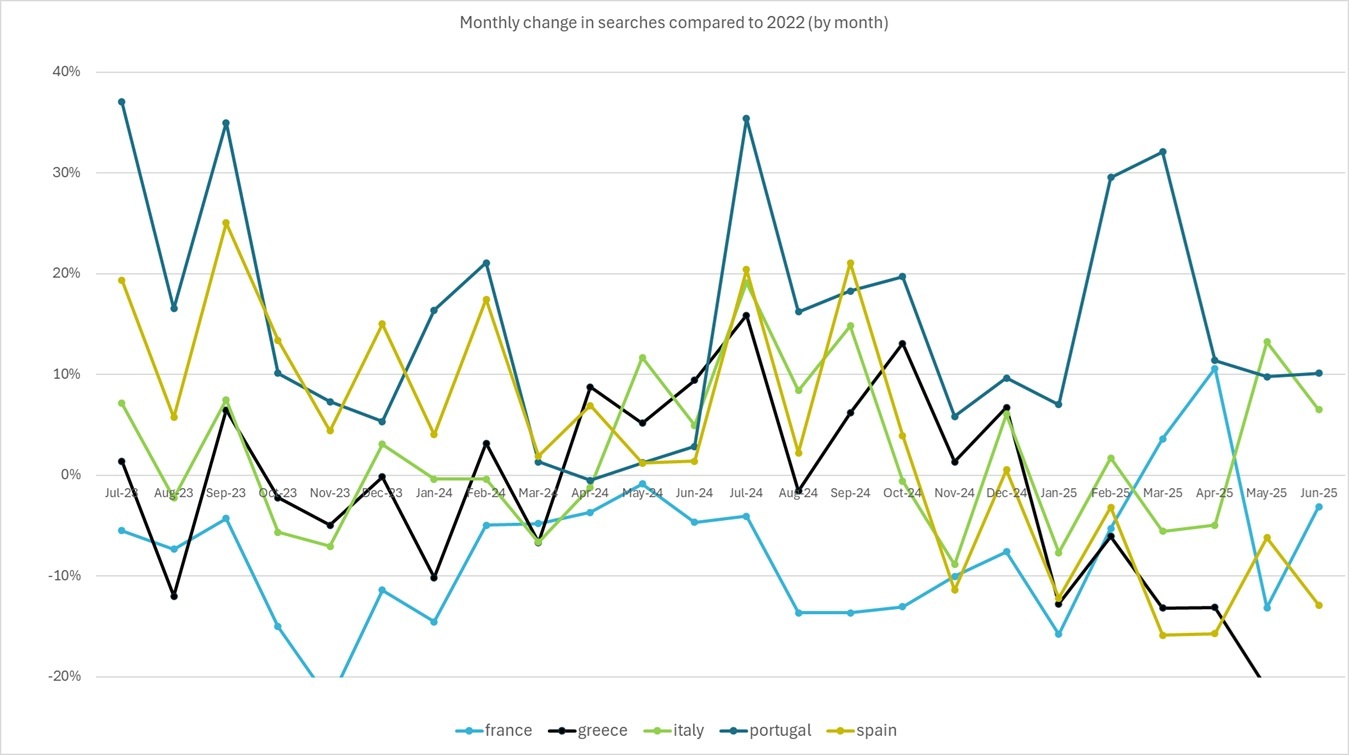
The biggest winner in search volume over the last two years of the ‘big five’ is Portugal, with above average searches consistently in the last two years, averaging an increase of 15% overall. France has fared worse, with consistently fewer searches and an 8% drop on average while Greece has had many ups and downs, particularly in 2025.
The other macro trend from this graph appears to be the comparative growth in searches outside of peak months for some destinations. Large spikes in from late summer 2024 and spring 2025 for Portugal showed more searches going on outside of normal months. This was also reflected in 2024 for Greece but as mentioned, since the turn of the year, there has been a big drop in overall searches which were only made worse after the terrorist attack in May 2025.
Sadly, the impact of world events such as terrorism and heatwaves across Europe are only likely to increase the variation in searches as time goes on. It’s important to keep track of temperatures in some of these destinations and if selling to them, doing as much as you can to educate travellers ahead of time or pushing to showcase areas in more temperate and stable times of travel. The rise of ‘coolcations’ is something we’ve spoken about previously and with many places across the globe hitting record temperatures this summer, this is likely to become a larger problem in the travel industry as time goes on.
How have cruise searches changed in the last two years?
With cruise holiday searches continue to grow, it’s worth looking at how and why in a bit more detail. Is there one specific part of the cruise sector that is driving more searches or are they all growing equally? As with the big European countries over the last two years, we have several big ‘chunks’ of the cruise sector in our data. These are Ocean cruise brands, river cruise brands, generic cruise searches and country specific cruise searches.
We looked into how these have changed month by month compared to 2022 and again there are some nuances in the data as show below:
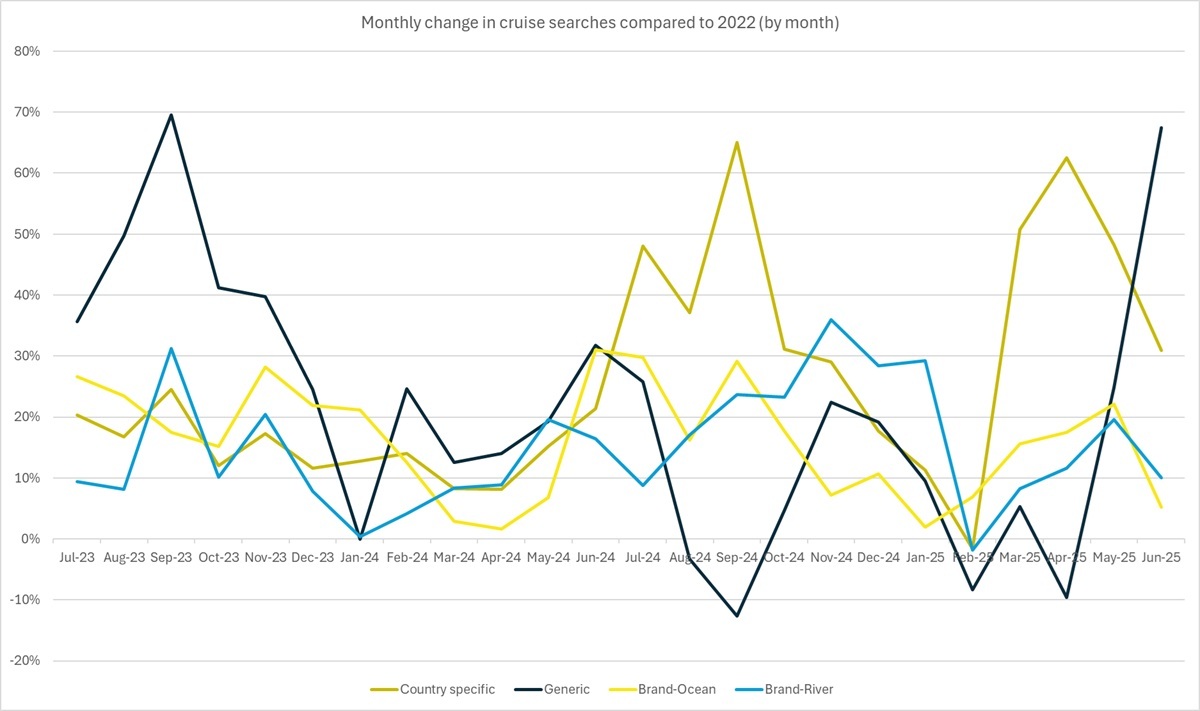
Overall, everything in cruise is up over the last two years which is fab, but there have been some swings in behaviour, with country specific searches peaking at different times comparatively whilst generic phrases have been on a slow decline in the last two years as cruisers perhaps move more to the brands they know or are aware of, particularly across river cruises. And if you’re wondering why there is a big uptick in June 2025, that was due to a HUGE increase in searches for the very generic phrase ‘river cruises’ which doubled in volume!
Final thoughts
On the whole, search volumes for travel are creeping upwards in 2025…but not by much. However, after a slow start to the year, we’ve seen some positive numbers overall and if we really are going to have a big lates market (as some have predicted) then we can only hope that Q3 numbers come through strong – watch this space!
And whilst the hype around LLMs in 2025 is vast, there is no sign of travellers jumping ship to other tools at this point. Overall volumes across the board are holding very steady and in the case of cruise, the only way is (still) up!


