Back in 2020, I looked at 200 travel websites to see how fast they were. Fair to say the results weren’t pretty…particularly on mobile.
Recently, I decided to run the study again to see if the sites fared any better. Surely in the last six years websites have improved and managed to make their websites load faster?
The short answer is yes – travel websites are faster in 2026 (phew!).
In this article, I’m going to explore why they’re faster and what still separates the best performing sites from the rest.
How I approached the research
As with my report back in 2020, I used PageSpeed Insights to measure the performance of a range of travel websites across the UK. Since then, the way that Google measures page speed has changed somewhat with new factors being introduced as time has gone on. But fundamentally, the aim is the same – to quantify the speed of a page.
PageSpeed Insights produces:
- A performance score out of 100 for desktop
- A performance score out of 100 for mobile
- Diagnostic metrics explaining what’s helping or hindering performance
For each website, I ran the PageSpeed Insights test and recorded both the mobile and desktop performance scores. These were then combined to create a single score out of 200, making it easier to compare sites against each other and against our 2020 dataset.
The sites analysed were selected from a mixture of well-known travel brands, specialist tour operators and companies that regularly appear in travel industry awards or publications. The aim was not to produce a perfect scientific sample but to get a representative snapshot of how the travel sector performs online.
Here’s what I found:
- 2026 average combined score: 109.2 / 200
- 2020 average (matched sample): 79.3 / 200
- Improvement: +38%
That’s a sizeable shift in gear in just six years.
While travel brands can take these results as a positive sign, it’s important to remember a score of 109 suggests there’s still room for further improvement (plus, just to put a momentary downer on things, Google would view this as a pretty low score overall).
To understand how those scores are distributed across the industry, it’s helpful to look at how mobile and desktop performance relate to each other.
What the data looks like
To visualise the relationship between mobile and desktop performance, I created a chart which plots the PageSpeed scores for the travel websites analysed.
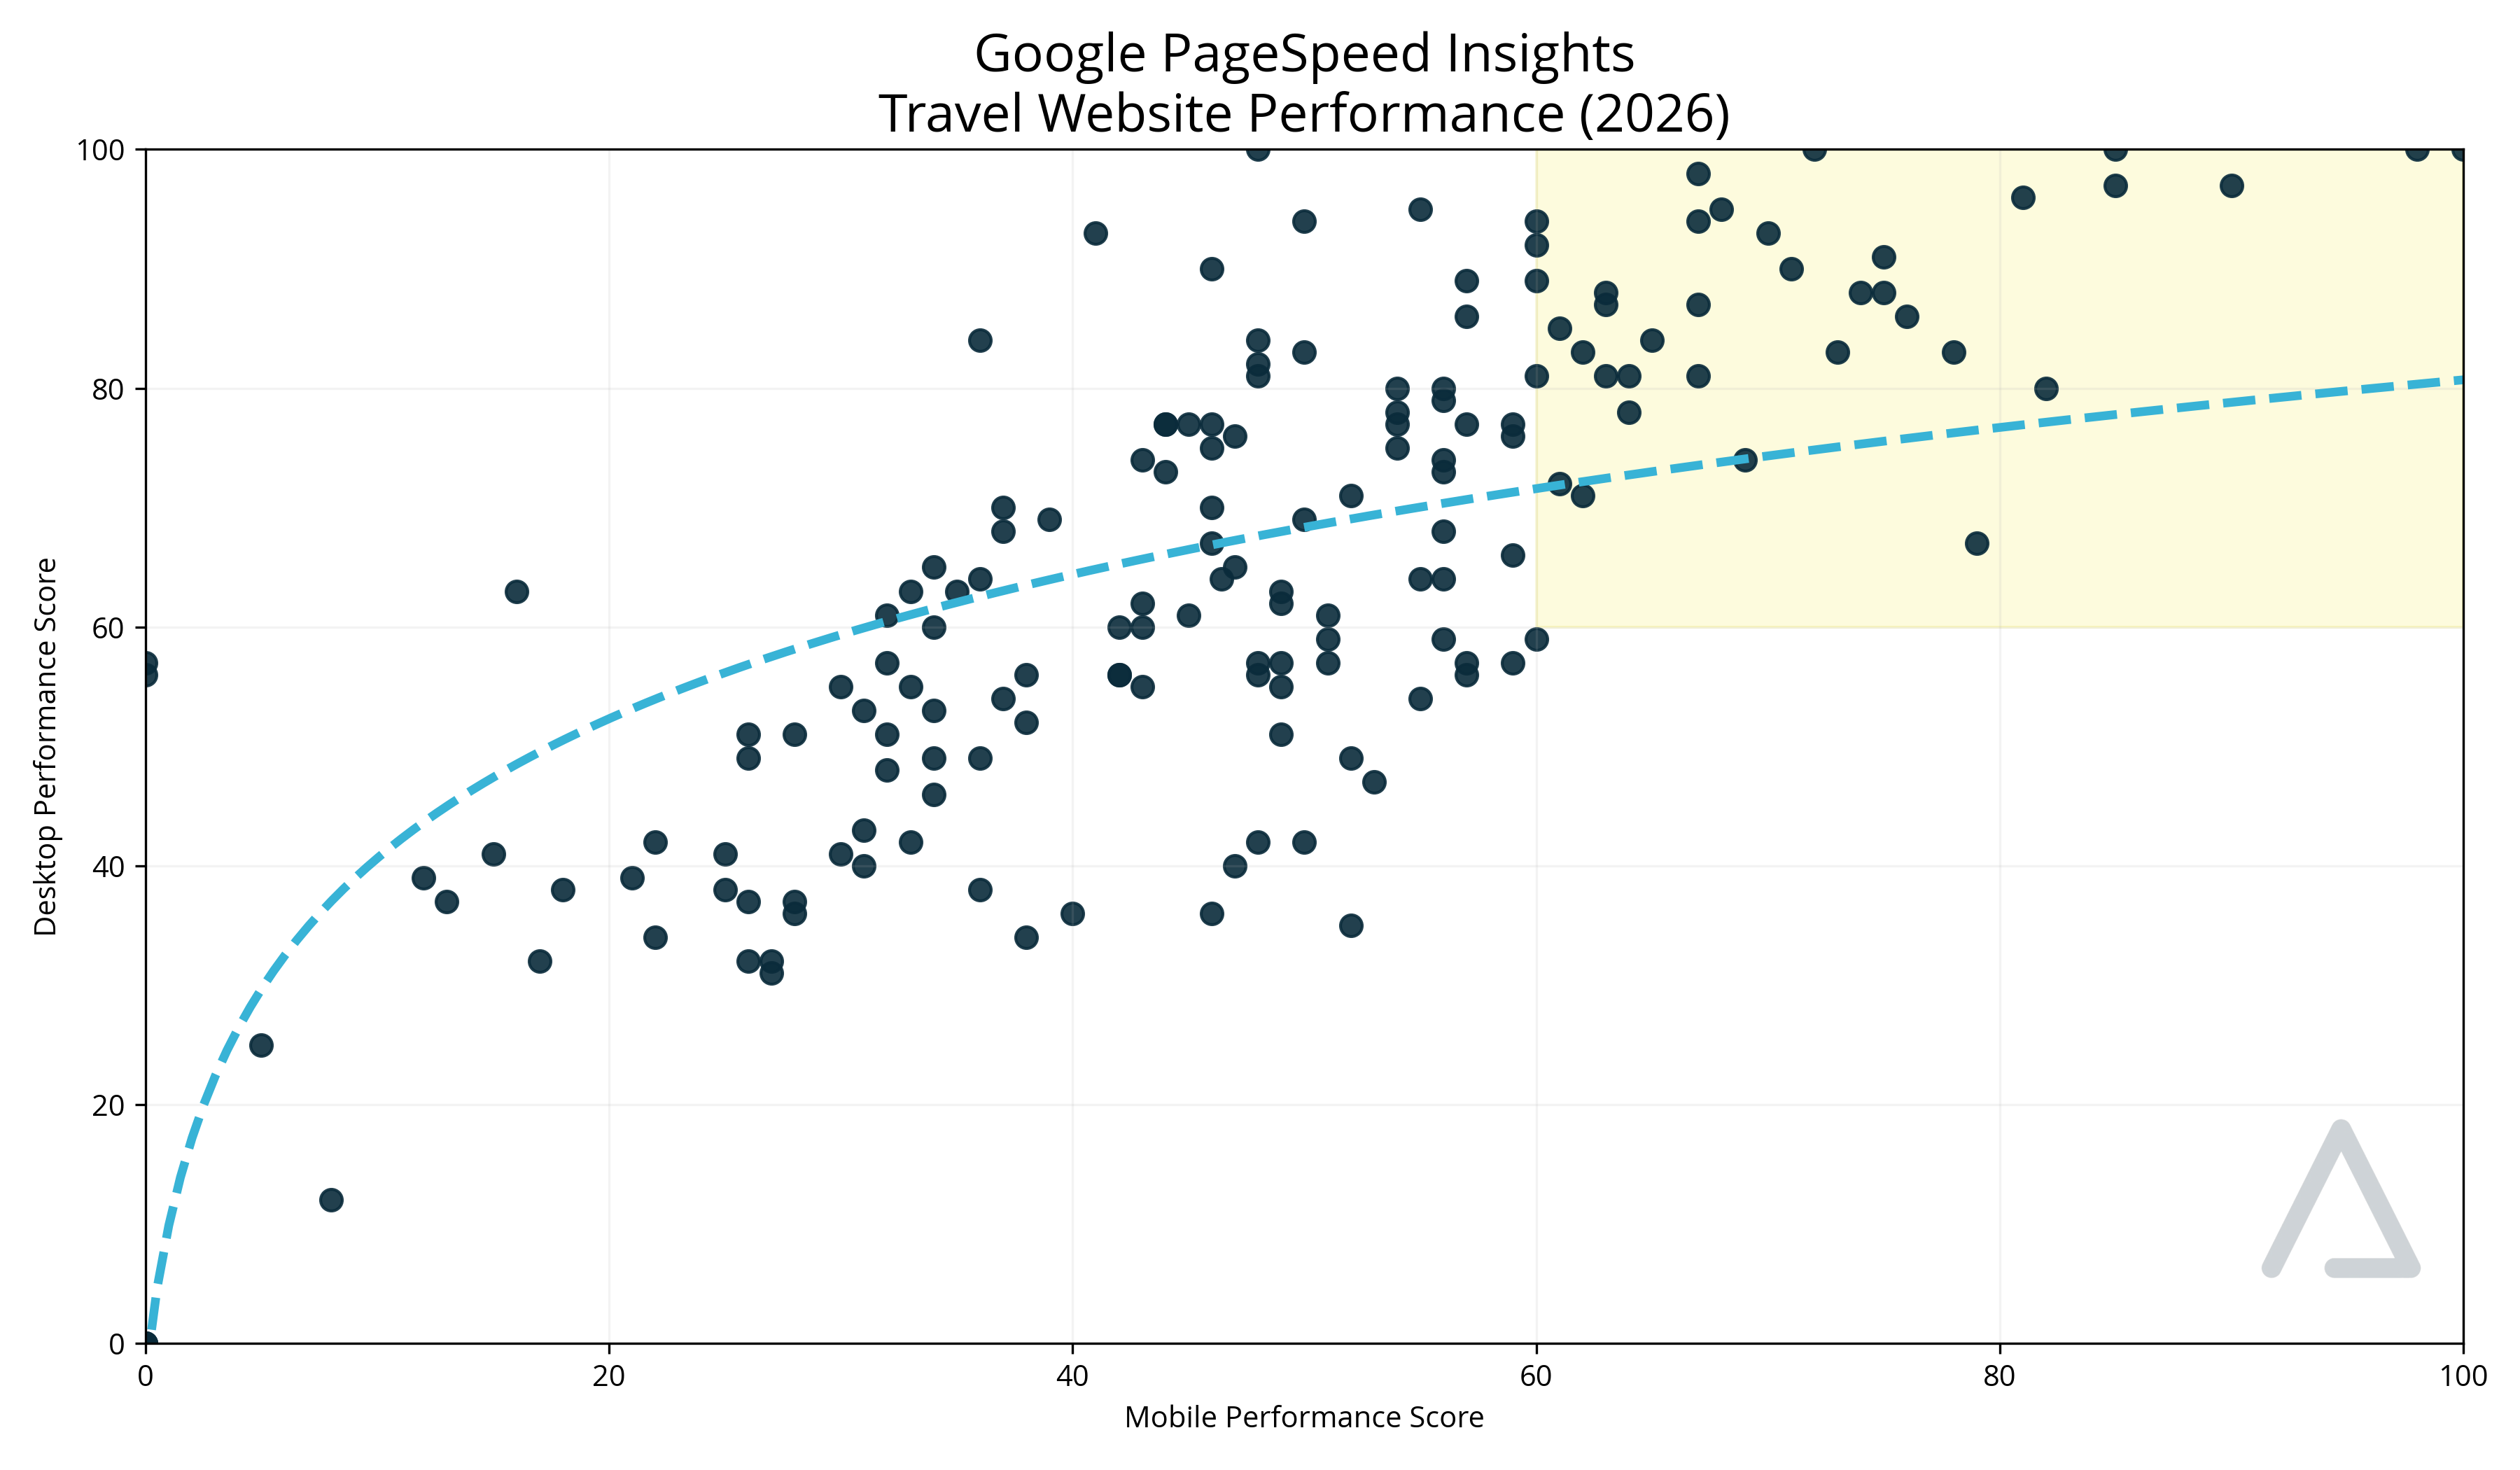
Each point represents a single website. The further right a point appears, the stronger its mobile performance. The higher it sits, the stronger its desktop performance. The shaded top-right area highlights sites performing strongly across both devices. In our dataset, 37 of the travel websites analysed fall into this quadrant.
At the opposite end of the chart, sites in the bottom-left corner struggle on both devices. These tend to have slower loading times, heavier pages or more inefficient code.
The dotted line running through the chart shows the general relationship between mobile and desktop performance.
The upward curve tells us something interesting: websites that perform well on mobile tend to perform well on desktop too. This usually signals strong technical fundamentals such as:
- efficient image handling
- disciplined script management
- stable layouts that don’t jump around
- sensible hosting and caching setups
Mobile is still not reaching peak performance
You’ll notice on the chart that desktop scores are often better than mobile. We saw this back in 2020 and it’s still evident today.
Mobile is where performance gaps show up most clearly.
Perhaps that wasn’t as big an issue six years ago. We were still in the realm of ‘big purchases are made on desktop’ (e.g. holidays), but that’s now changing with 70% of travellers now research travel on their phone. People browse destinations, compare hotels and check prices throughout the day. If your site is slow or unstable on a phone, you’ll lose intent early.
Research conducted by Deloitte found that a mere 0.1 second improvement in mobile site speed correlated with a 10.1% increase in travel conversion rates on average. Even if your uplift isn’t identical, the relationship between performance and revenue is clear.
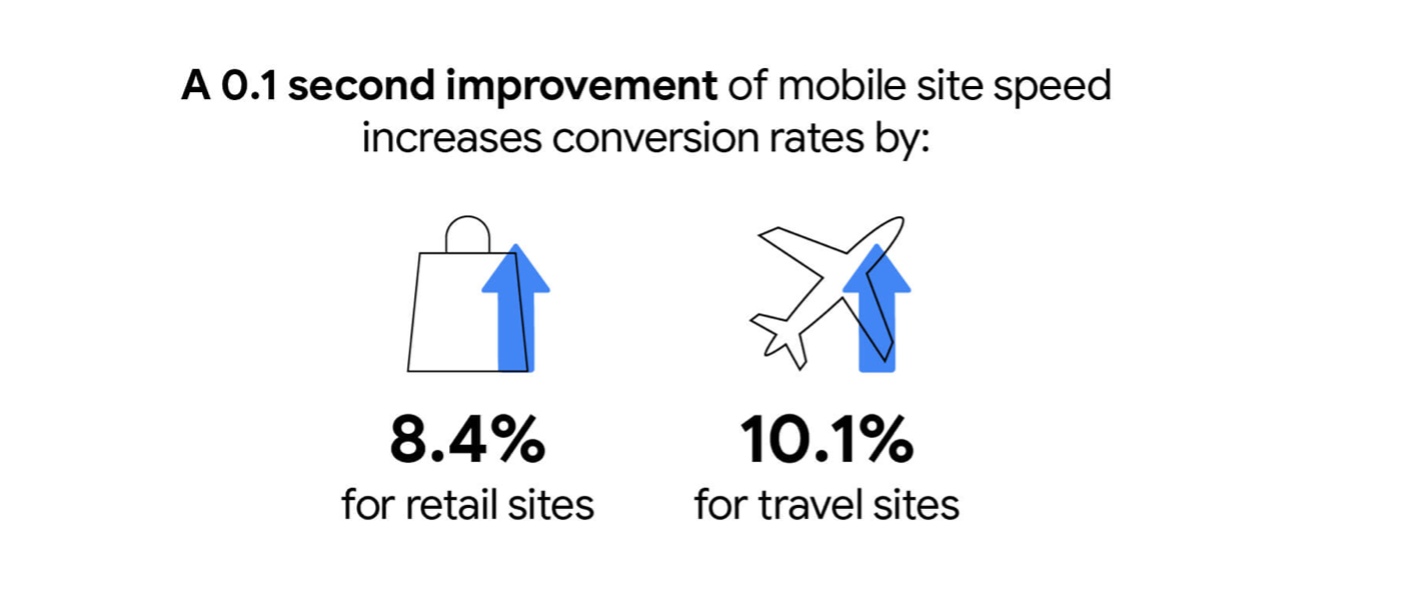
When improvements in speed can translate directly into commercial impact, even small gains start to matter.
The biggest improvers since 2020
Some brands didn’t just improve slightly – they practically reached Usain Bolt levels of speed.
Top movers in our dataset include:
- offbroadwaytravel.com (+148)
- swordstravel.co.uk (+128)
- oliveloungetravel.co.uk (+126)
- swordstravel.co.uk/luxury-family/ (+123)
- thamestravel.net (+106)
Increases like this are rarely the result of one minor fix. It’s usually a rebuild, a platform change, a serious hosting upgrade or a conscious and focused clean-up of years of accumulated scripts and weight.
The strongest performers right now
At the top end of the scale, a handful of websites are scoring exceptionally well across both mobile and desktop.
The highest combined scores include:
- atlantic-travel.com (200 / 200)
- iglu.com (198 / 200)
- offbroadwaytravel.com (187 / 200)
- flexiblecarhire.com (185 / 200)
- bigworldsmallpockets.com (182 / 200)
Not all of these are household names, which reinforces the point that prioritising site speed can yield great results, even for smaller, lesser-known brands.
Does site speed really matter?
Site speed absolutely does matter – especially when it comes to travel.
Travel decisions are emotional. People are seeking inspiration - imagining places, reading details, flicking through galleries and comparing options. If that journey feels sluggish, confidence drops and your audience moves on to a faster competitor site.
There’s also the SEO angle. While Core Web Vitals won’t catapult a site to the top of Google, they do play an important part of how Google evaluates page experience. Faster, more stable pages are better positioned to compete in organic search over time.
Speed alone doesn’t equal great UX
It would be easy to treat PageSpeed scores as a one-stop shop. Improve the number and assume performance is solved.
In reality, speed is just one element of the wider user experience.
You can have a fast site that still underperforms if:
- navigation is confusing
- the booking journey is clunky and convoluted
- mobile layouts feel cramped
- forms are long and hard to complete
Users won’t hang about on your site, however speedy, if they can’t find what they need or have to jump through endless hoops.
What we often see is that performance problems and experience problems show up together. The sites that perform best usually get a few simple fundamentals right.
A simple way to frame it is:
- Speed gets people in
- UX keeps them there
- Clarity gets them to book
What’s driven travel site speed improvement since 2020?
1. Core Web Vitals made performance visible
User-centred metrics made it easier for performance to become a business conversation rather than just a developer concern.
Over the past six years we’ve seen this first-hand. Many website design briefs we receive now include explicit targets to improve site speed or PageSpeed scores by a defined percentage.
In projects where speed has been treated as a priority from the outset, those targets have often been achieved. For example, our work with Canadian Affair delivered significant improvements in performance (see our case study for more info).
What this shift really shows is a broader industry awareness, i.e speed is no longer seen as a technical nice-to-have, but as a key success measure in modern website projects.
2. Clearer tools
PageSpeed Insights now surfaces both lab and field data more transparently, helping businesses focus on real-world experience rather than chasing synthetic scores.
3. Improved infrastructure
Modern platforms, CDNs and hosting environments are better by default. The baseline across the industry has lifted.
Where travel sites still struggle
Despite the improvement, some common issues seen back in 2020 remain. This includes:
- oversized imagery
- too many third-party scripts
- layout instability caused by late-loading elements
- backend bottlenecks on search and booking pages
These are all solvable problems, but they require ongoing attention rather than one-off fixes.
Practical next steps
If you’re looking at your own site and wondering where to start, focus on:
- Fixing your image pipeline
- Auditing third party scripts
- Deferring non-essential code
- Stabilising layout
- Reviewing hosting and caching
- Setting a performance budget
Small, deliberate changes can often lead to sizeable gains. And thanks to the use of better coding practises and improvements in AI, what might’ve once been a week’s worth of development time can now be done in hours if you know how. There really isn’t any excuse for poor coding and experience in 2026.
So, are travel websites faster?
Yes (hooray!).
The data shows a clear and meaningful improvement over six years.
But the bigger story isn’t just that the industry has improved. It’s that the gap between average and excellent is still wide.
The best performers demonstrate that speed, usability and clarity can work together. When they do, the website doesn’t just feel faster. It converts better.
If you’re struggling with site speed and want to understand what might be slowing things down, drop us a line and let’s chat!


