At Adido we pride ourselves on analysing data, understanding trends and being ahead of the curve in a digital landscape that is in a near-constant state of evolution and flux. No easy task, but one we love, because we care about marketing and our clients’ performances.
Like many marketers and agencies, we report back to clients on their performance and compare year over year (YoY), month over month (MoM), or over a custom time period to understand trends that inform evaluation and decision making. Data will always fluctuate so, comparing YoY is a great way to analyse performance, because it helps alleviate seasonality, something that affects most businesses.
Conversions, revenue, traffic, and other metrics fluctuate during different times of the year, because most organisations will have a peak season and an off-peak season, although for most it’s not quite as cut and dry as that. YoY comparisons tend to give the clearest picture of performance and we will always prefer to compare YoY if we have the data available.
But how can you compare data following a global pandemic?
Of course, Covid changed the world. We have seen many of our clients prosper following the initial trepidation of what ‘lockdowns’ would mean. With users driven online due to restrictions, many ecommerce websites for example saw huge increases in traffic, conversions, and revenue.
Now that we have Covid in the rear-view mirror (hopefully for good), consumers are returning to pre covid routines, though 62% of shoppers say they shop online more now than pre-covid, according to influencer marketing hub.
So, what does this mean to the data many marketers rely on?
In short, it has meant YoY data has not been quite the analysis flagship it habitually has been. If you are comparing YoY data, I would say it needs to be taken with a small (or rather large) pinch of salt. As you can imagine and as mentioned above, in spring/summer of 2020 and through the early part of 2021, restrictions meant websites were being visited more than ever before.
Now we are another year on, almost halfway through 2022, when we try and compare Q1 of 2022 to the same three months of 2021 the usual story is, most metrics are down. This leads to disheartened assessments of current performance, unrealistic expectations and generally an unfair measurement of how well a website is faring in the here and now.
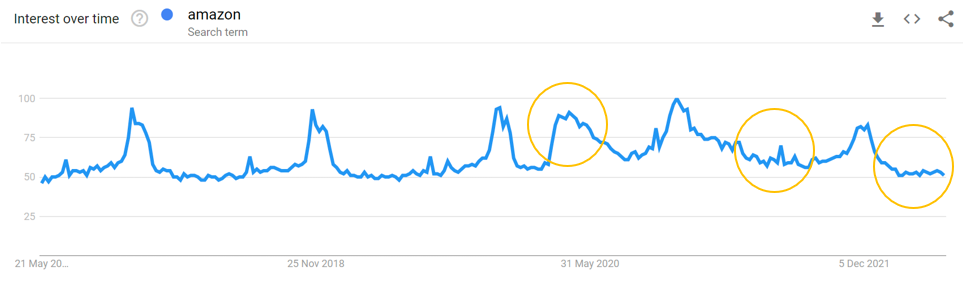
The above example shows the trends and search volume for Amazon and highlights the decline in search volume following the pandemic. With usual seasonal peaks around Black Friday in November and through the Christmas period, a new peak appeared in March/April 2020. Subsequent years have seen a gradual decline in searches, falling in 2021 and falling again in 2022.
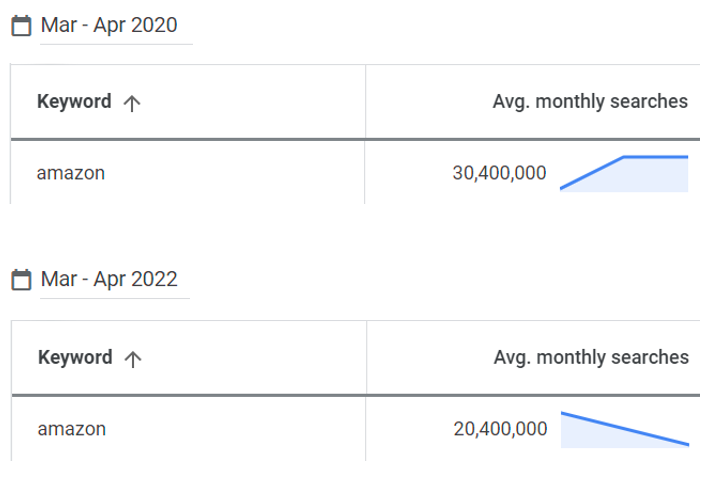
When looking at March and April in particular, there were 10 million less searches for Amazon in 2022, compared to 2020, and we can be fairly confident that this isn’t because Amazon has done something to affect its brand awareness/demand.
As a data led agency, we could analyse this until the cows come home, worrying that there was a significant problem. Though the pandemic might not be the only reason metrics are down, it is the most likely reason.
So, we find ourselves comparing to a time never before seen in a digital age and worrying that we’re no longer seeing such peaks when in fact those peaks were artificial. Throw in additional GDPR regulations and you could be losing more even more tracked data and skewing the perception of reality!
So, what can we do?
At Adido we like to rely on data, as do our clients, so while we are in this state of flux with so much data being warped due to the last two and a half years, we cannot focus solely on YoY data.
We still might reference YoY data in any reporting or analysis; however, we will look to group that with MoM insights as well as trends over 3 or 6 months and look back to pre-pandemic annual data if available. Combining all the above time frames should provide the clearest insights and minimise the influence of Covid only comparisons.
Something in addition to the above that has worked well for us is, comparing the previous month vs. the last 3 months This can help get an understanding of recent performance and any changes in behaviour whilst being mindful of any potential seasonal fluctuations during this period. In addition, we combine this data with competitor analysis, looking at keyword search volume, price competitiveness, auction insights and content to understand whether others are experiencing similar changes in SERPs or being more dominant in PPC. This gives a good idea of how to benchmark performance, and determine what good looks like, when YoY is not comparable.
Using these different methods can be more time consuming than good old ‘YoY’ but it allows us to give our clients perspective and understanding dependent on their goals. If you are looking to understand changes in performance, you should use recent data to understand seasonality. If you are looking to forecast, you’ll need expert knowledge, account familiarity and industry tools to understand search volumes and competitiveness from which to predict and guestimate.
Fortunately, there are many ways to analyse data when YoY isn’t available and in a funny kind of way the pandemic has caused us to become more creative in the way we report and provide insights which should only be a good thing really.
A final thought
At Adido we are committed to our clients, helping them achieve their marketing goals. We use data almost religiously but have found that: over the last 2 years the data has been much harder to interpret and to quantify. Perhaps you’ve felt the same thing too?
Our curious nature means when situations like this arise, rather than admitting defeat and saying it’s not possible, we will gather the best data possible to provide commercially sympathetic answers to our clients’ questions, but always acknowledge that we have all been operating in unprecedented times over recent years.
The information shared in this article only scratches the surface of our analytical capabilities so if you’re finding it a struggle to make sense of your performance reports and would like some assistance then we might be able to help.


